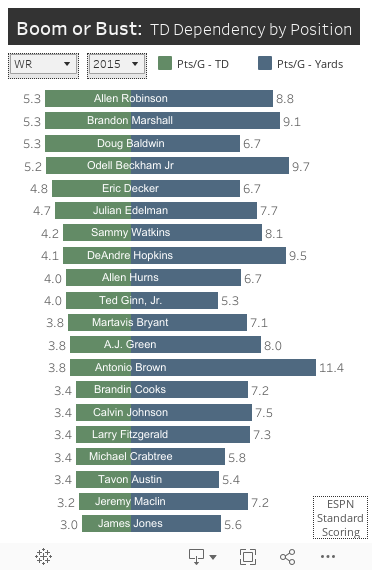
In MAWFF#1, we looked at the scoring trends by position over the last 10 years in standard scoring fantasy leagues. Some might say that a point is a point, but when it comes to touchdowns, it's 6 (4 for standard league QBs) or 0. This leads to wild score swings for players who rely heavily on reaching the end zone. So I wanted to take a look at the players who depend most on this aspect of scoring, in an effort to consider who I should be wary of repeating their 2015 performance.
Here's a look at the fantasy players who depend most on the TD:
So you need to decide for your team: Do you want a player that produces on the field each week and is reliable for 5-10 pts by yards gained, or do you want a guy that is going to go big some weeks and score 3 pts when they dont reach the end zone? Look at Demaryius in 2013, Dez in 2014, and... 'Doug' in 2015. All 3 relied heavily on their TD production to achieve their great seasons. I like to make sure the offense will be the same before betting on this kind of performance again. Is the QB the same (cough... Romo)? Has the offense lost a guy whose nickname is Beastmode? How will that affect that guy's ability to get into the end zone. Look at Tyrod and Cam last year. About the same production from yards gained, but Cam scored a touchdown per game more. Kirk Cousins found the end zone plenty last season, but are you gonna bet on Kirk Cousins? TE, look at Julius Thomas 2014 vs 2015. 3.8 points from yards each year, but a drop from 5.5 points from touchdowns to just 2.5 a game. Same on field production... [At this point I realize I ended up with him at the end of my auction draft... and... replaced. Phew. Pretty sure I just reverse jinxed him, so you should start him week 1]. Looking back through RB, it's fun enraging to see the vultures make the list. Look at 2010, Javarris James 1.6 points from yards per game, but he scored 6 touchdowns in 10 games played. Lol, who? #specialist What do you guys think? Does anyone else like to break it down this way?
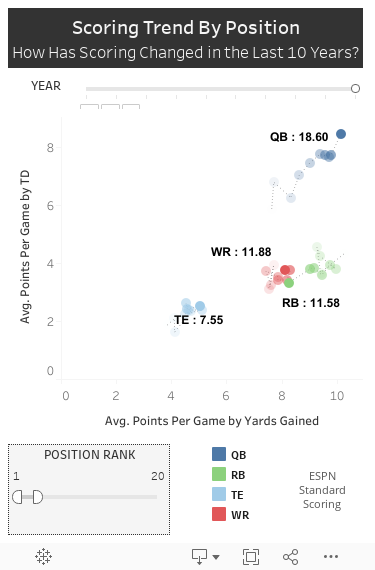
In this first MAWFF post, I take a quick look at how fantasy scoring has evolved over the last 10 years. In the graph below, I show the following:
Top 20 Players by Average Points Per Game by Position by Year
Must have played at least 10 games
Graph compares Points Per Game by Yards Gained vs Points Per Game by TD
A couple notable trends stick out:
QB: Notable rise in points per game in both yard and TD points.
RB: Reduction in both yard and TD points. This could be due to a reduction in overall RB productivity as the passing game has increased and/or a spreading of the RB load with more RBs by committee in use.
TE: Small but meaningful increase in TE offensive productivity, especially at the top end with the likes of Rob Gronkowski and Jimmy Graham.
WR: Not a huge change over 10 years. With the increase in QB productivity, the receiving yards and TDs look to be going to non-top 20 WRs. TEs and pass-catching RBs are the likely beneficiaries.
What do you guys think? How has this affected your draft over the last couple years?
Wow, what an awesome way (or annoying way if you are a Dave Castro hater) to start the games this year. ICYMI they made the athletes meet at 3:30am on Wednesday morning and flew them up to the CrossFit Ranch in Aromas where the inaugural Games were held. Whatever / Wherever / Whenever, amiright? Now while I’m sitting here writing this, the women are completing Murph 2.0. They nerfed Murph (giggle) this year by partitioning the reps, but it has still pushed these athletes to the limit – I don’t care how you split up the 600 Murph reps, you are going to face muscle failure... and then have to run another mile. And that is amazing, because these are the top 40 fittest men and women in the world… or are they? With only 5 spots available from each Regional, it’s very likely that some great athletes won’t be competing at the Games due to the Regional that they competed at. There are clearly stronger Regionals that might deserve more than 5 bids, and conversely there are weaker Regionals. In part 4 of this series I’ve been doing on the CrossFit Games, I set out to score all 8 Regionals against each other to see how well the current system did at selecting the top 40 athletes. CFHQ has shown that they are always evolving this process, which has improved, and I believe will continue to improve. To finish this piece I’ll take a look at some ideas to help achieve that end.
GETTING STARTED
Before we look at the scores, I tried to eliminate (or at least be conscious of) any bias that might skew the results. I first thought there might be an advantage to the athletes that competed in the 3rd week due to them having more time to practice and strategize events. Here are the average times / scores for each event by week:
There does appear to be some advantage, but with a small sample size, it could be due to just having a stacked Regional. I wanted to improve this, so I eliminated the outliers by normalizing the Open scores of the athletes and considering only those within 1 standard deviation of the mean Open score. Let’s take another look.
That is a much different picture. There is almost no improvement for the men and none for the women. There are some other forms of bias that I cannot do anything about, such as the fact that most of these competitors didn’t actually compete against one another. That is that an athlete might work just hard enough to win his Regional when he could’ve done better.
SCORING
So with that out of the way, let’s talk about scoring. For this exercise I chose to score the Regionals like the Open. Scores for each event are rank ordered with your place in an event awarded as your score. An athlete's overall score is equal to the sum of his/her places in each event. The athlete with the lowest overall score is in 1st Overall Regional Place.
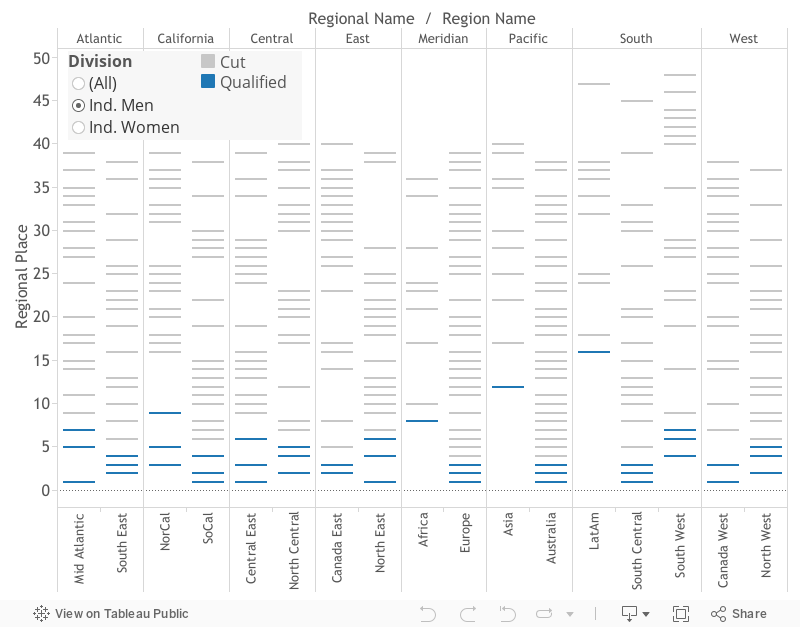
There are obviously other ways to attempt an overall scoring of the Regionals. The order may change, but the point is the same. Not all Regionals are created equal – it’s easier to make it to the games in some Regionals than others. In a system set up the way these Regionals are, you can’t hope to get the top 40 athletes every time. This is a problem that many sports face, and people usually write off strong divisions to seasonality – that in the long run things even out. Where The CrossFit Games differs is that it is an open tournament with geographically based bids. Yes, some athletes do move around, particularly in North America, but it's not the same as a free agent / draft system that seeks to prop up weaker teams. The CrossFit Games is still young, relatively speaking, and they make changes every year. As recently as 2014, each Region (17) held its own Regional. In that system, the top 3 athletes qualified for the Games in many Regions, with fewer in some. These would be the Games qualifiers in 2016 under that system:
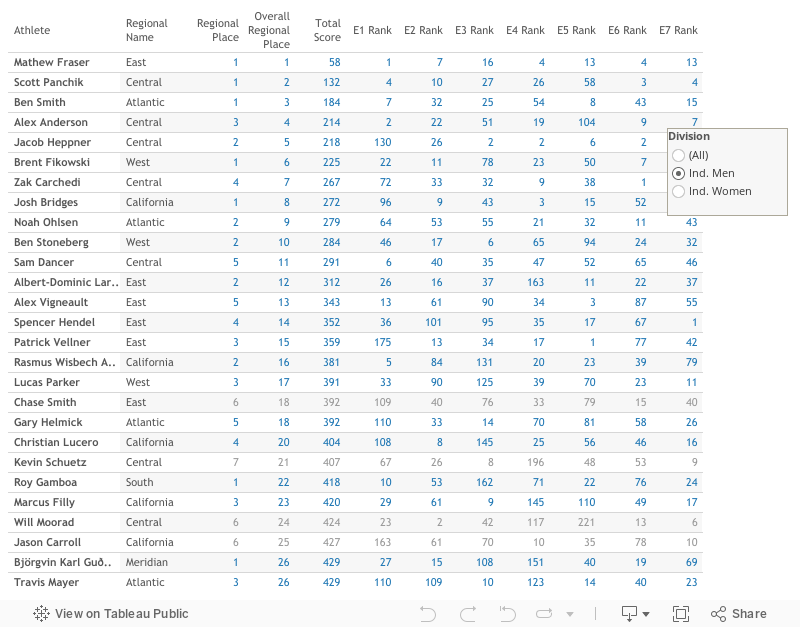
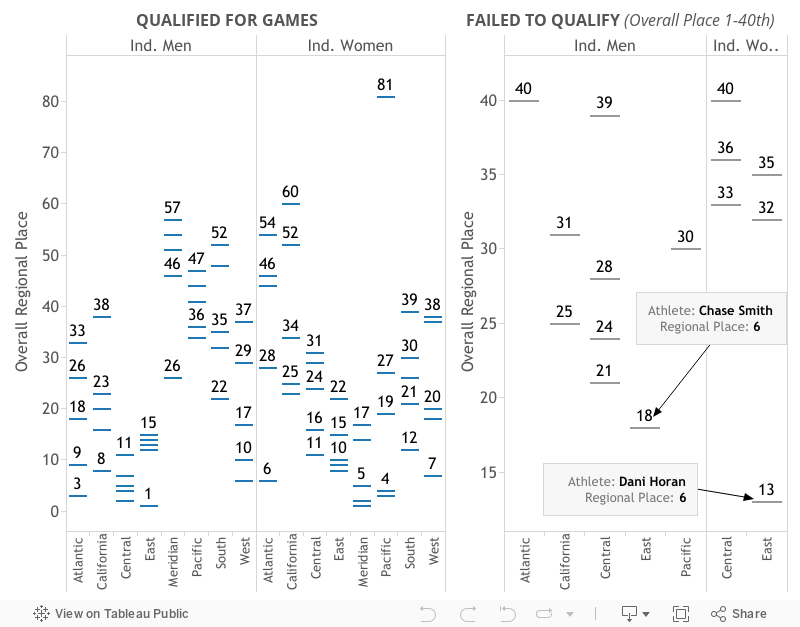
Combining 17 Regions into 8 Regionals is a big improvement, as it lowers the error and allows strong Regions (e.g. Europe Women) to win 5 bids. When the Europe Women previously had only 3 bids (2014), then reigning champ Samantha Briggs finished in 4th place and failed to qualify. Under the current system she would have qualified at the expense of a likely lesser athlete from the Africa Region. Despite the improvement, there are still some seemingly worthy athletes that didn't make the cut. Here is a look at this years qualifiers and their Overall Regional Place:
There is definitely improvement, but still 6 women and 9 men who theoretically might be top 40 didn't qualify. When the 13th best Regionals competitor fails to get 1 of 40 spots, there is an argument to be made for changes.
IDEAS FOR THE FUTURE
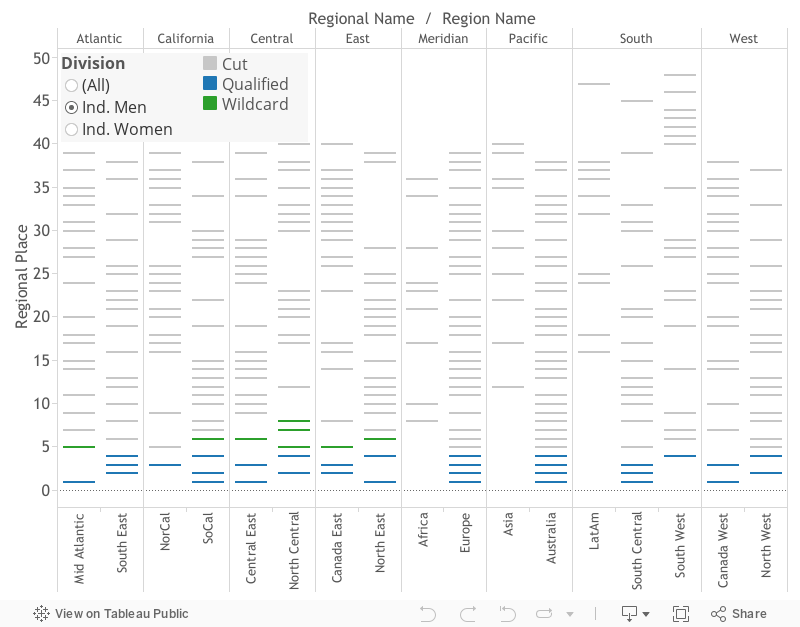
I’m certain that CFHQ is taking feedback and planning improvements without my help, but here are some ideas I have to improve the process. As with many of the major sports (in America at least), they could consider creating wildcard bids for the best athletes who did not auto-qualify at their Regional. To begin this could mean altering the current system by reducing auto-bids to 4 (32 total auto-bids) and adding 8 wildcard spots to be awarded to the top 8 finishers across all Regionals. Of course to do that you also need a scoring system that can be used to compare the athletes from different regions. You could also allocate wildcard bids to 'Super-Regionals' such as 'The Americas' and 'The World'. To quantify the impact of potential changes, I’ve taken the average overall place of all 2016 games qualifiers under the different selection systems:
1) Old System (Bids for each Region) 2) Current System (5 bids for each Regional) 3) Wildcard System (4 bids for each Regional / 1 Wildcard per Regional) To judge the effectiveness of a system, I've defined the following term: Selection Error = Average Overall Place – 20.5 20.5 is the theoretical best (lowest) Average Overall Place. If a system selects the top 40 placing overall athletes, the average place will equal 20.5. The smaller the Selection Error, the better the method.
The wildcard system would make another huge jump forward in the selection process. Here are the athletes who would've qualified in 2016. It is clear that strong Regionals are rewarded, while still pulling athletes from around the globe:
CONCLUSIONS
No, the Regionals process wasn’t perfect, but it is getting better. I don’t want this to come across as harsh criticism, because that is not my intent, nor is it deserved. More than one major sport has dealt with a similar issue recently. Until recent years, the NBA was dominated by the Western Conference, leading people to suggest the league takes the top 16 teams overall to the playoffs instead of 8 from each conference. The MLB added another wildcard team to the playoffs a couple years ago and has the wildcard teams play a ridiculous 1 game series to get into the real playoffs. Conversations around these issues usually lead to the same conclusions: 1) do we really care that much about the worst teams to get into the postseason, 2) just win your division… Ultimately that is how I feel here > #WINYOURDIVISION. There are other advantages to a wildcard system though. Mainly with the possibility of an athlete on the bubble getting in, it keeps bubble athletes working as hard as possible thereby improving the competition. Also, it ties a nice little bow around all of the Regionals, which might cause more fans of week 1 Regionals to watch the week 3 Regionals to see who will get the wildcard bids.
So keep doing what you’re doing CrossFit, and I look forward to what you have in store for the future.
With news of Tim Duncan's retirement this week, it is time to take a look at his place amongst the great power forwards in NBA history. I found this list from ESPN that seemed like a good place to start. With 26,496 career points, he sits 14th all-time. I've always loved Timmy's bank shot, and hated meeting him in the playoffs. Did you know he is also one of the best defenders at his position? As I dug into the stats in this group, this one really stood out:
Just incredible, zero career personal fouls committed. Not a single one. Perfect. Contrast this with the Mailman's 4,578, and you can start to understand exactly what we are losing from the game.
You might be saying, that's not possible. But the career block numbers back this up:
Added a few Venue Names, added a new feature to the dashboard (seasonality), and started getting into scrubbing the dataset.
Data Issues
Many of the venues have reported more than 12 months of data, which so far is usually due to having multiple reports in certain months. In some cases the extra report is for $0 (no harm there), but in others it's not so simple. Are these extra reports amendments? If so, there is some double counting going on. You can see in the tooltip how many periods are counted (should be 12). For now I've just started making note of these discrepancies.
Borrowing the concept from my last post on Texas Alcohol Revenue, a friend pointed me towards the Colorado tax receipts on Retail Marijuana Sales:
It's hard to pull much out of this dataset besides "wow that's a lot". Sadly the state does not report sales by individual business as in the Texas Alcohol example. I hoped to see clearer seasonal trends, but it is difficult to do so in the early rapid growth stage. There does seem to be a slight dip in Q4, possibly due to family holidays? I guess this isn't a family activity quite yet...
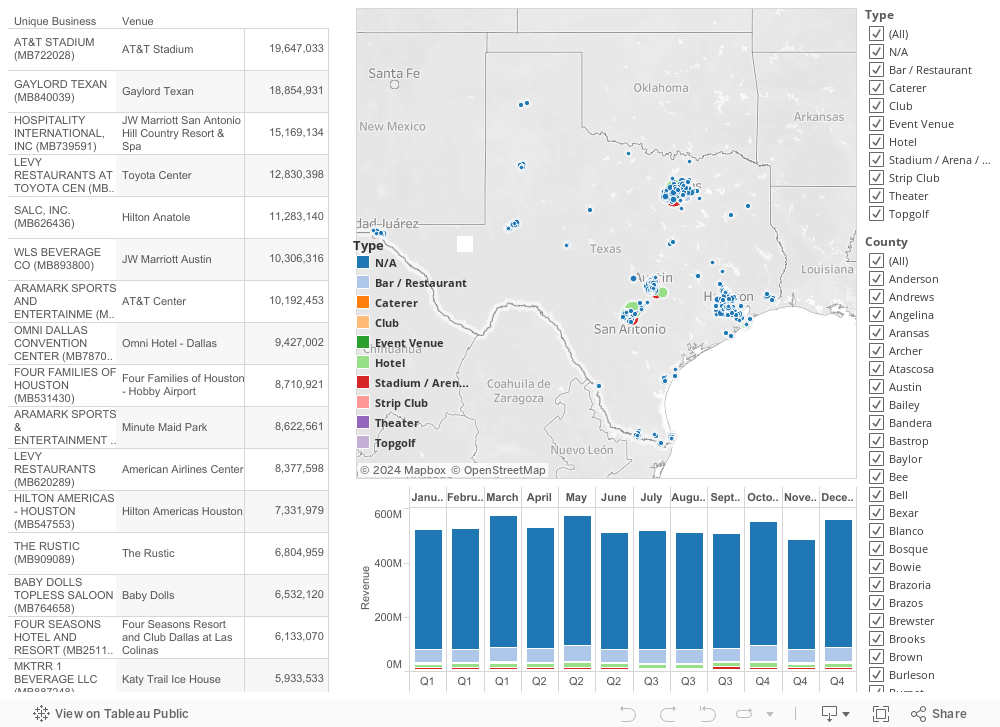
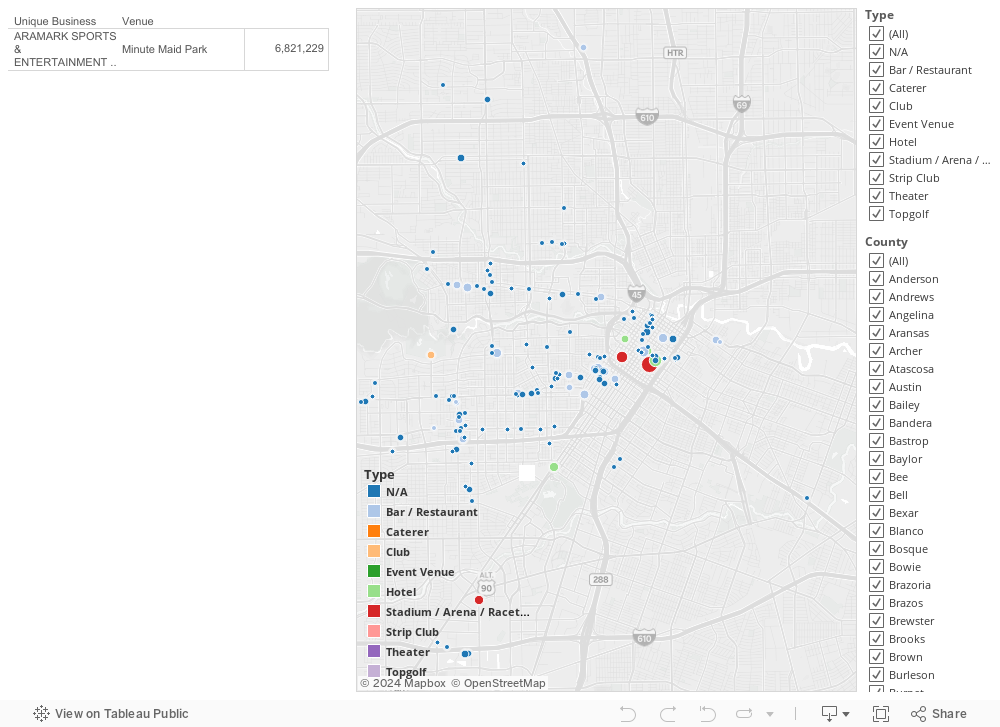
Thanks to some friends, I found a fun set of data to work on this week. Here in the great state of Texas, we like our drinkin'. Due to certain taxes that must be paid to the state for the privilege of selling alcoholic beverages and the public nature of those filings, we can back into the revenue generated by alcohol sales at any venue in Texas. Newspapers/local blogs like to sift through this and post "top 10" lists. It makes for a nice slideshow post (barf). 'Hey what hot new bar that we should've thought of is killing it???' So I set out to do better... In order to do that, I've considered the entire state together, and put a considerable amount of legwork into adding context. More importantly, I have an interactive interface to view the data. To start, there are over 15,000 businesses that report. For the time being I filtered out anything below $1.0mm in annual revenue which culls the list down to about 10% of the original. The tax filings data only includes the name of the legal entity, which can be anything. Sometimes they are obvious, sometimes not. So I set out to add actual business names and a "type" category. Type is a broad category, which I hope to subdivide later for even more context. At this point I've added detail for the top 200 businesses and tackled some franchises all at once. I hope to chip away at the list as I update the data. There also seems to be a lag in reporting, so I've conservatively chosen to start a couple months back.
You can filter by type and by county -> Dallas / Ft. Worth Metro = Dallas, Tarrant, Collin, Denton Counties, Austin = Travis County, Houston = Harris County, San Antonio = Bexar County (pronounced bear to be safe, if not necessarily accurate)
In order to do the map plotting in Tableau I had to get latitude and longitude of each business. In order to do this I used a simple python/pandas script and google maps api. I'll try to get that up on GitHub soon. It worked pretty well, but if you notice any glaring location errors please let me know (my first plot put some businesses in Kansas). Also as far as errors go, I can't for the life of me figure out why Topgolf Allen isn't in these reports. I looked at every entry from Allen and nearby cities, it's not there. If you have an idea why that could be, please let me know (wild speculation encouraged).
If your state/country has similar data, I'd love to know. It would be fun to compare across states. If you have any other ideas/suggestions to improve this, please comment! -ReEngiNerd Let's Connect! Tableau Public Repository GitHub @reenginerd on Twitter & Instagram
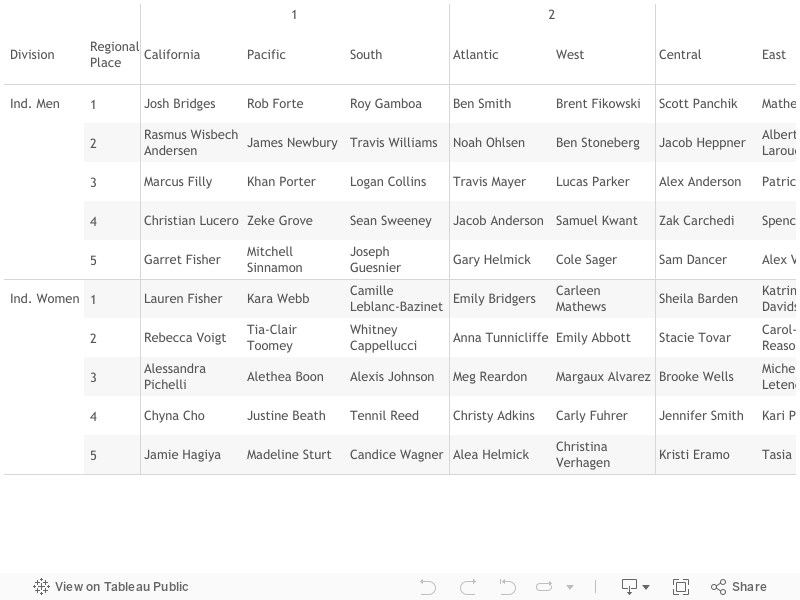
For 3 weekends in the month of May, over 300 individual athletes in both the Individual Men’s and Individual Women’s divisions competed in 1 of 8 Regional competitions. Each of these featured 7 events over 3 days, and each came with 5 tickets to the CrossFit Games.
Here are the qualifiers from each Regional:
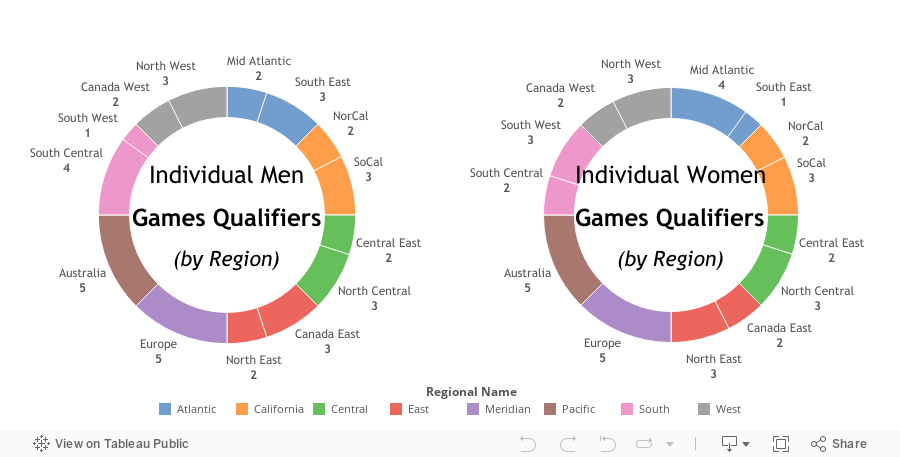
This is a breakdown of the Regions that produced each qualifier:
What Does A Games Athlete Look Like?
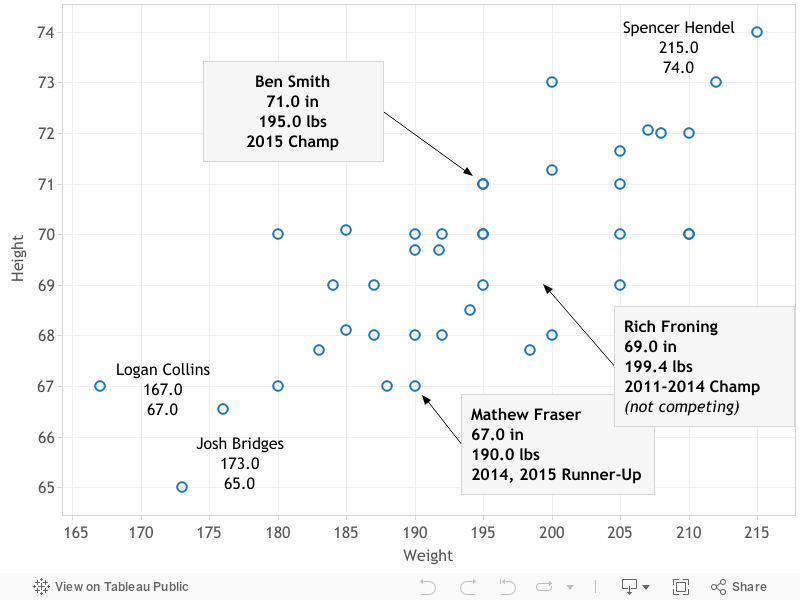
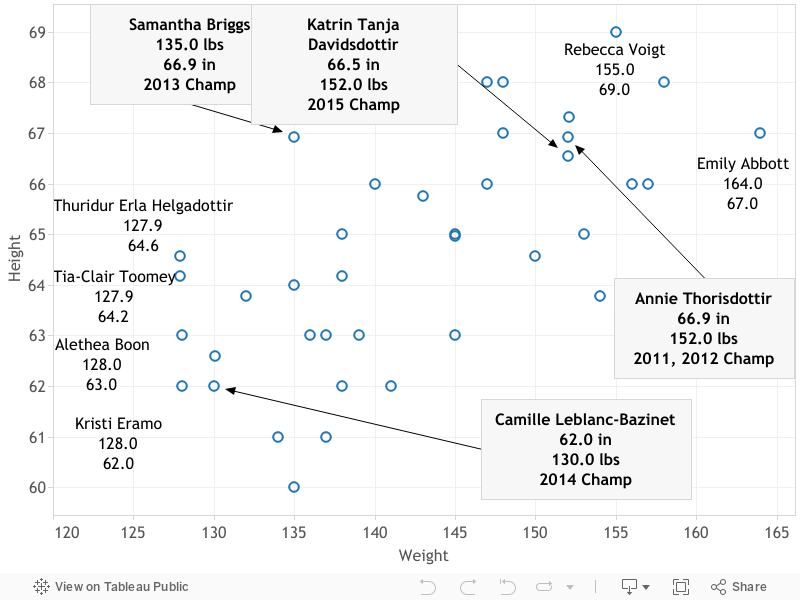
There is a general idea in the CrossFit community that CrossFit has a bias toward shorter athletes, but do the numbers support that? I’ll start with a simple scattergram of height and weight. As you can see there is quite a range of sizes.
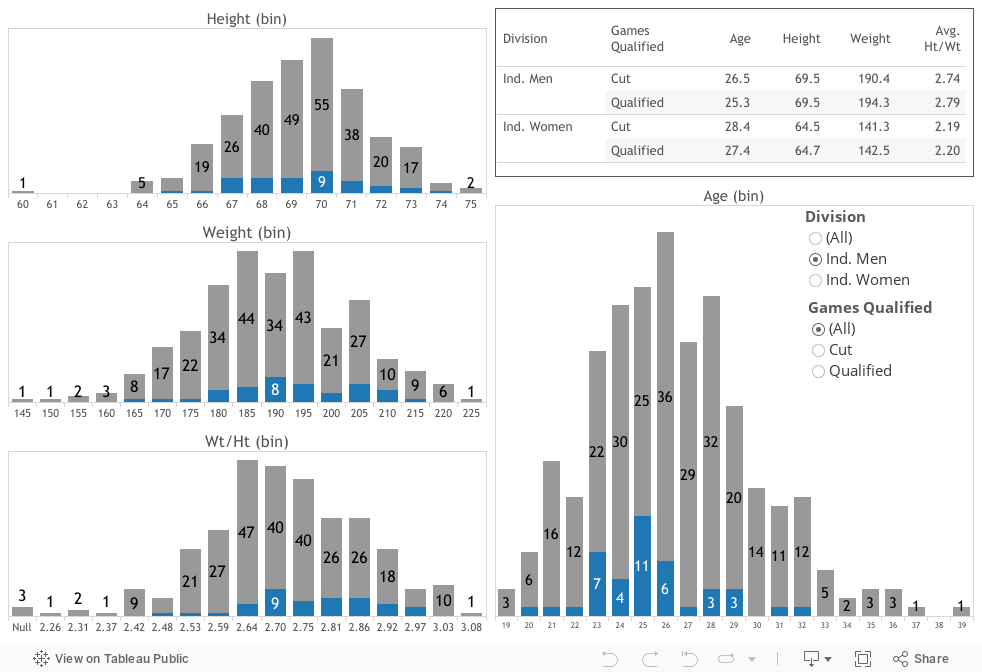
The distribution of sizes has a nice normal shape. In addition to size, I looked at age, and the ratio of weight : height.
Just looking at the numbers, it’s clear that there are many more male athletes in the 5’8”-5’11” range, but does that mean anything? The average American male is about 5’10”, with only about 23% of U.S. men taller than 6’. Based on the 2016 sample, the average Regionals athlete (both male and female) is about .5 inches shorter than the American average each with a lower standard deviation (more tightly packed around the mean).
TAKEAWAY: There are more factors to control to tighten up this study. For instance, I’m comparing more than just American athletes to the American mean. I’d like to add results from previous years to expand the sample size and further refine this research. With that said, the data does suggest a small bias to the 5’8”-5’11” range for men and 5’4” for the women.
How Much Better Is A Games Athlete?
CFHQ beat me to the punch on this one (sort of). Here is a look at the average benchmarks of Qualifiers vs Cut athletes. (Note: Benchmarks are self-reported and took quite a bit of scrubbing…)
TAKEAWAY: On the women’s side, there is specific emphasis on the lifts, and the Fran/Grace times reflect that. The better you can move a barbell, the better you are going to fare in the competition. There are actually 2 benchmarks that the Cut athletes did better in – Filthy 50 and Sprint 400. It’s possible that there is some issues with the self-reported data, or this might be a reflection that the Regionals favored stronger athletes over faster ones. For the men, Snatch was the key lift with C&J also showing a meaningful delta. The Qualifiers do a better job of converting the raw strength of deadlift into the skills needed for the Oly lifts (more on this in a future post). This is reflected by the Grace times, but interestingly, the Cut athletes had similar Fran times. Qualified athletes on average finish the Filthy 50 a full minute faster. The ultimate chipper with 500 total reps, this works out to an almost 2 reps / minute faster pace – they add up. CFHQ's piece on this has some good historical data on their post, check it out here. FINAL WORD: Not much to do about your height, but if you are like me and want to improve your Open performance next year you would do well to hit the barbell on a regular basis. As one of my favorite athlete’s to follow on Instagram says “Lift Heavy Often As In Everyday” (@elijahezmuhammad). Next in this series we’ll take a shot at figuring out if the best 40 athletes made it to the Games, and how this compares to the past (and future?). -ReEngiNerd
In Part 1 of this series on The Road to the CrossFit Games I covered the Individual Men who qualified for Regionals. If you missed it, there is a little more explanation about the graphs. In this post, we'll take a look at the same charts for the Individual Women.
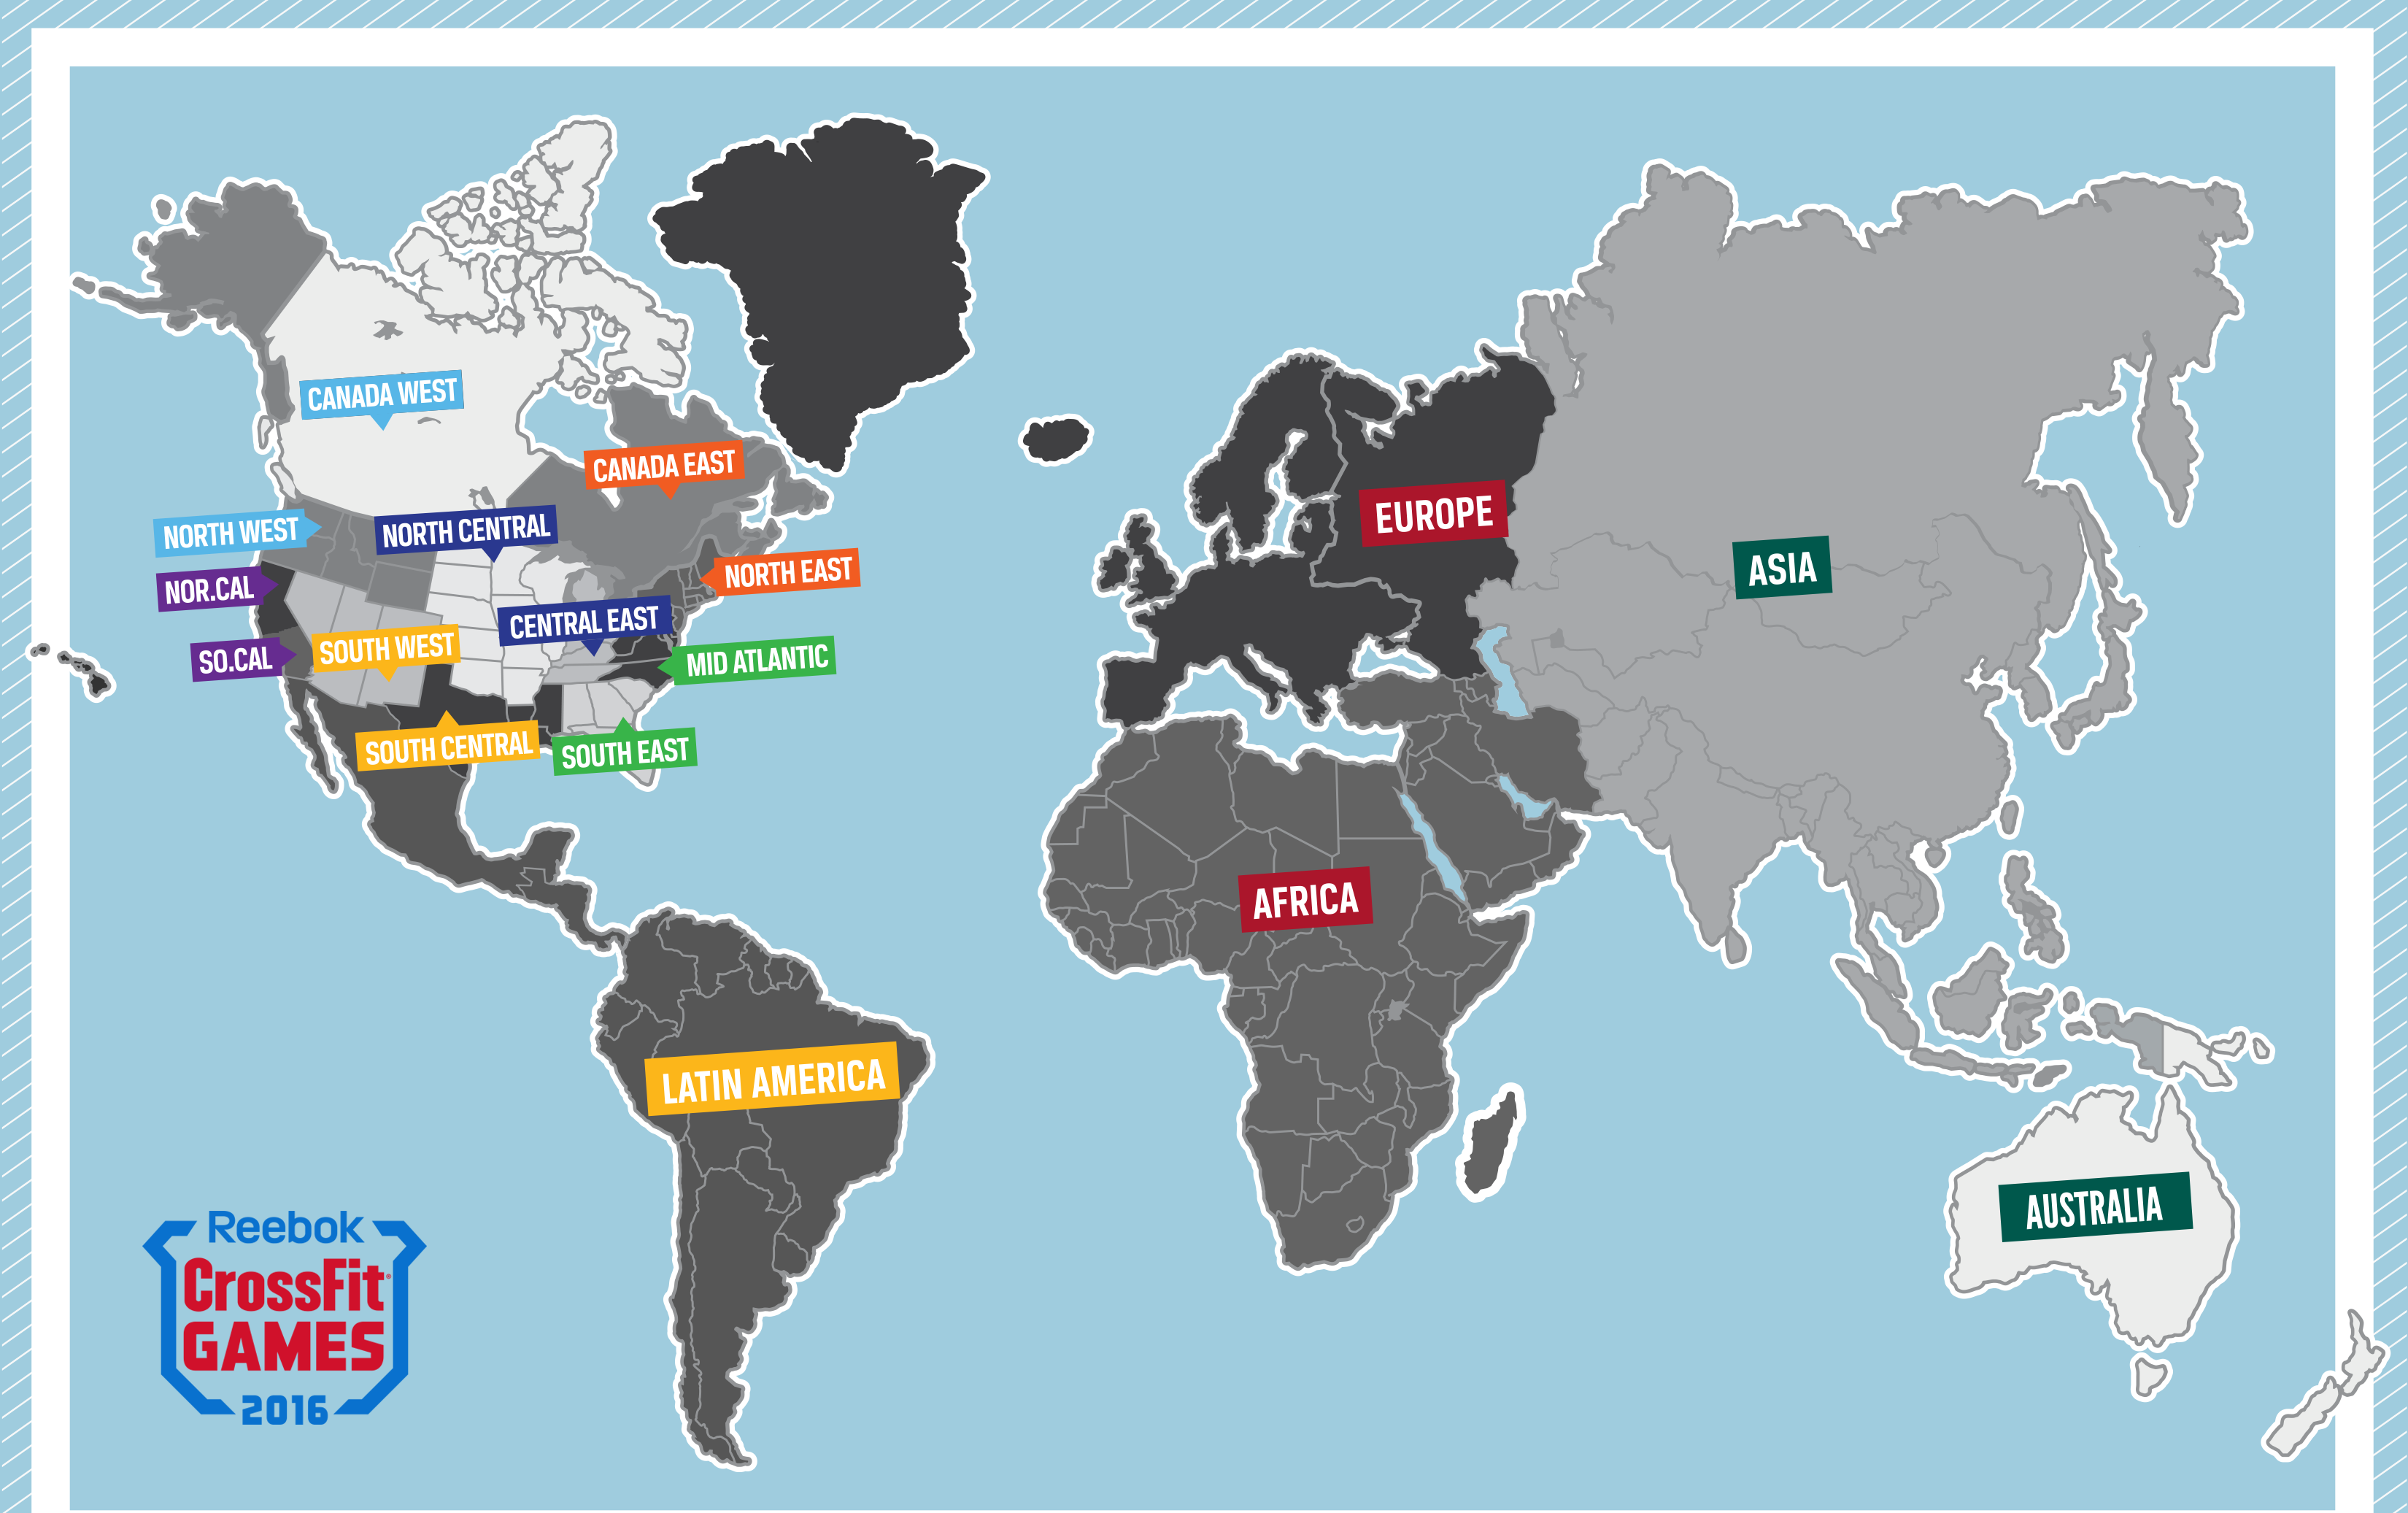
WHO GETS IN
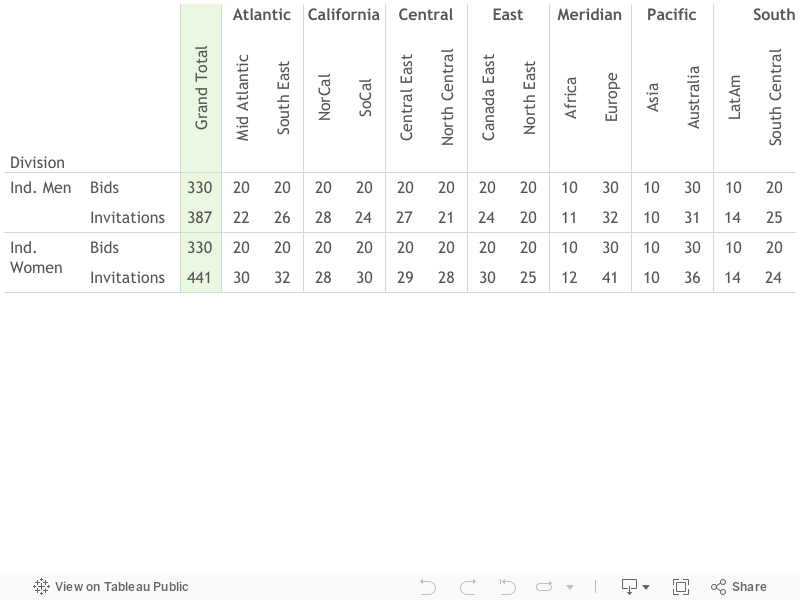
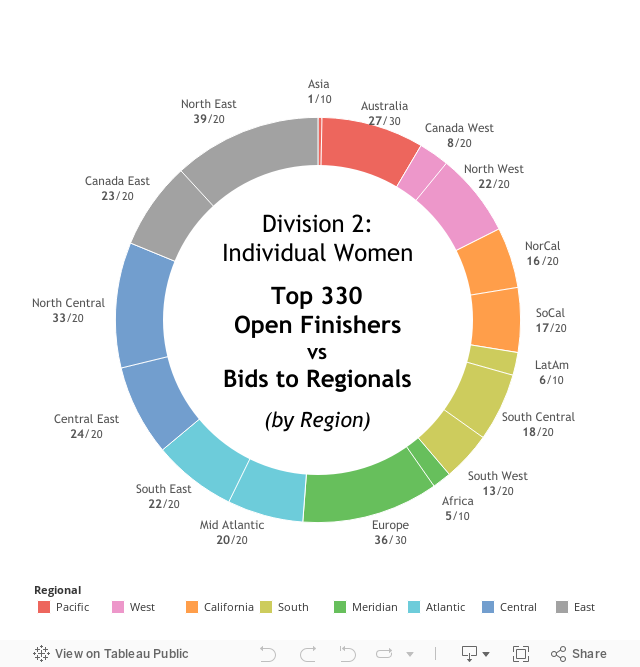
As before, 17 Regions feed the 8 Regional events, most of which receive 20 'Bids'. Australia / Europe receive 30, and Asia / Africa / Latin America (LatAm) receive just 10. Here is the breakdown:
441 Invitations went out to athletes in the Individual Women division to fill the 330 available Regional spots. It took 54 more Invitations to fill the spots than in the Men's Division. 109 women opted to compete on a Regional Team, compared to 56 men. This accounts for most of the difference between total divisional invitations. I guess women are better team players...
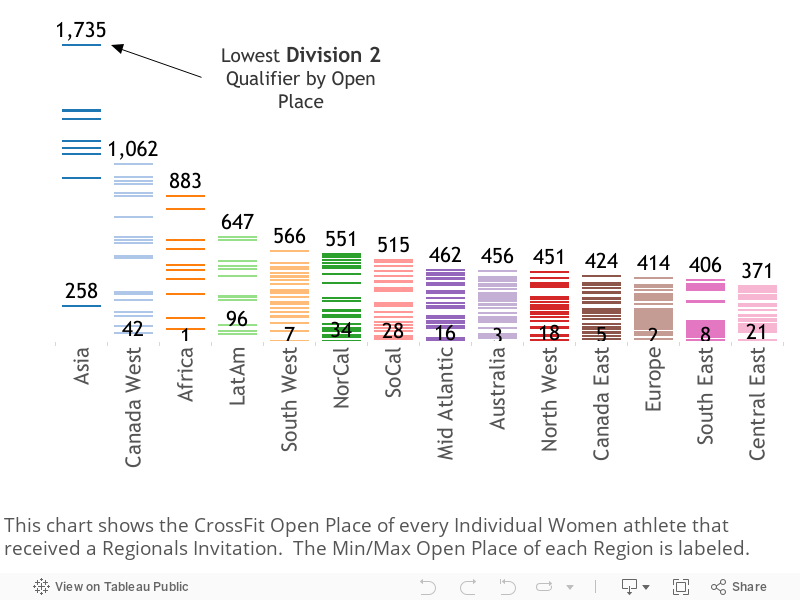
Here is the same Region breakdown by Crossfit Open finish as in part 1:
As with the Men, a couple regions stand out. Asia's last qualifier came in 1,735th place in the open. Canada West moved up to 2nd to last in this division, with their lowest qualifier at 1,062nd. North East region does quite well, just as their men did.
WHO DIDN'T MAKE IT
Again if 1,735th made it, someone who did well enough to earn a spot didn't get in. Let's see who got the shaft:
In all, 58 athletes did well enough in the Open to earn an Invitation. This is fewer than on the men's side even though there were 54 more Invitations available.
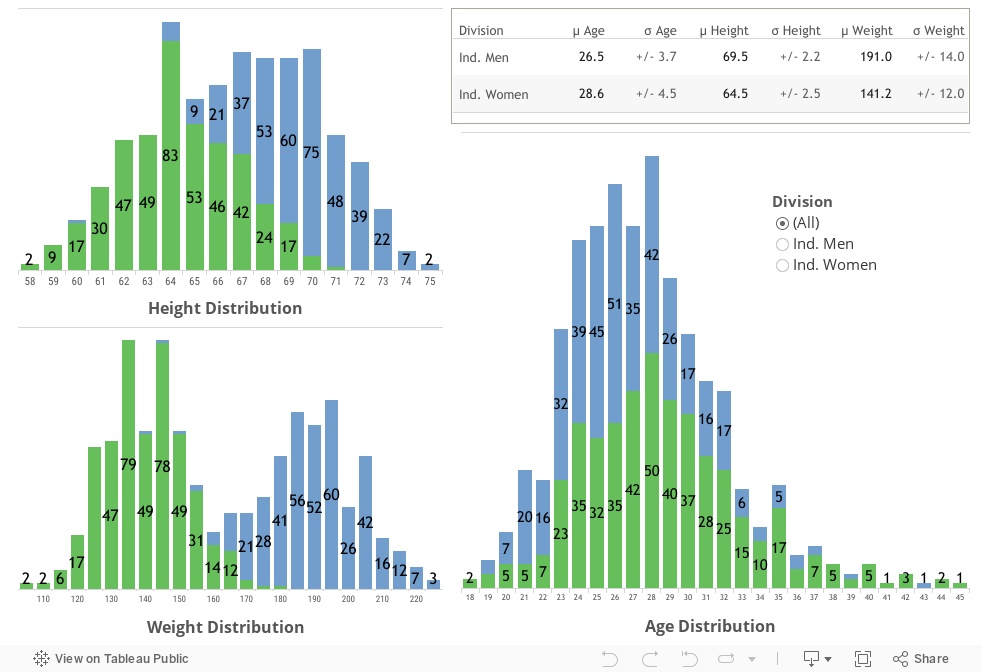
WHAT DOES A REGIONAL COMPETITOR LOOK LIKE
Here's a quick breakdown of Regional athlete height (inches), weight (pounds), and age:
Obviously, the men are taller and heavier on average, but it's interesting that they are about 2 years younger on average with a lower variance.
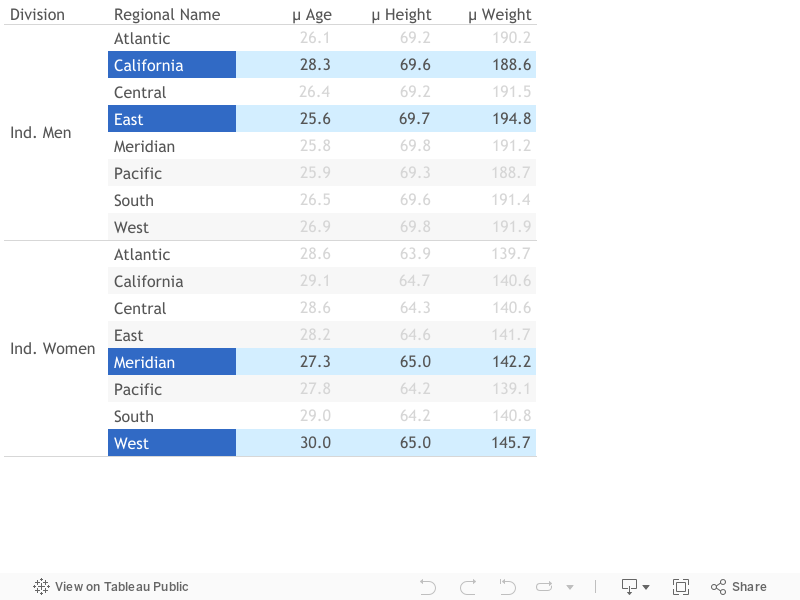
Looking around for regional differences, these age averages seemed notable:
CLOSING THOUGHTS
Similar results as in part 1. The women did have far fewer athletes do well enough in the Open to qualify for Regionals and not get an Invitation. And I'll close with the same graph that looks at the top 330 open finishers by Region:
In Part 3 of this series I’ll look more at what the stats mean in relation to the workouts and maxes, and attempt my first CrossFit advanced stat. At some point I also want to see if any of the data I’ve collected could’ve helped us predict who would perform well at the Regional competitions. Stay tuned!
Check me out on GitHub for the code I used to scrape the data from the Games website. I'd love to hear your ideas and feedback! -sof
The road to the CrossFit Games continued last weekend with the first 3 Regional events, and as a former CrossFit Open participant (43,692nd place in 2015 Open!) I was curious about what it takes to make it to the Regional level. The CrossFit Games website offers a fair amount of data to work with, from the CrossFit Worldwide Open Places and Scores, to athlete data such as Age, Height, and Weight. Many of the athletes also self report some benchmark scores and weights that I hope to do something with in the future. That data is not as complete, so I'll stick with Open Place and the personal data for this first go round. For an overview of the Games process, check this out.
WHO GETS IN
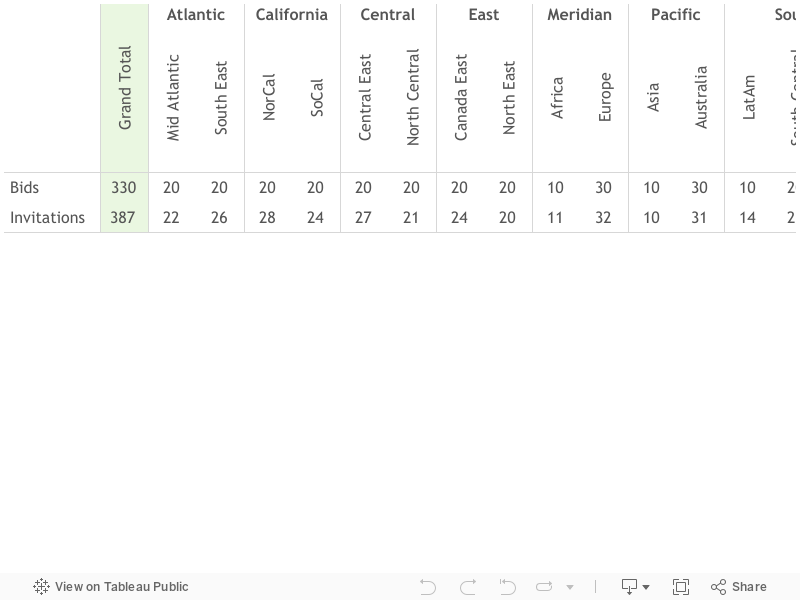
17 Regions feed the 8 Regional events, most of which receive 20 'Bids'. Australia / Europe receive 30, and Asia / Africa / Latin America (LatAm) receive just 10.
In all, there are 330 Regional 'Bids' up for grabs. Many athletes who qualified chose to compete on a team or declined altogether, in which case the Region receives extra 'Invitations' until it fills its allotted Bids. Here is the breakdown:
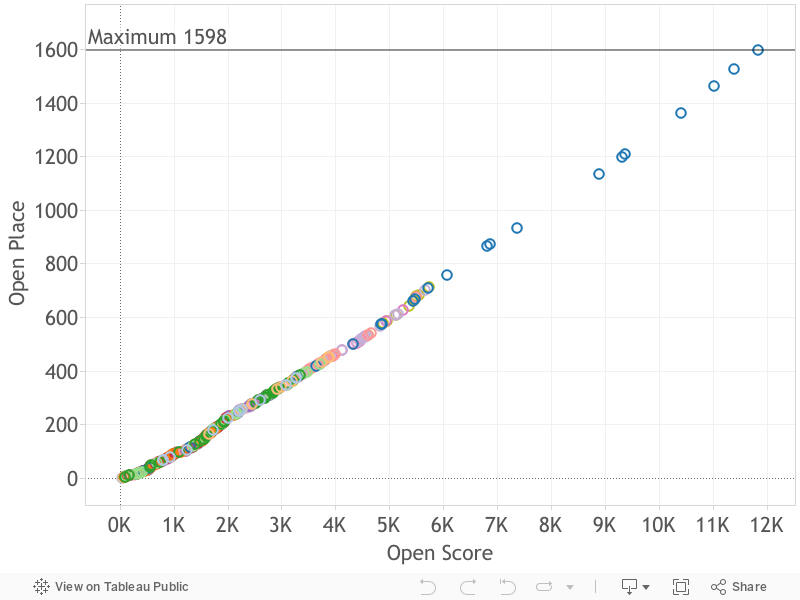
387 Invitations went out to athletes in the Individual Men division to fill the 330 available Regional spots. So I fired up Tableau to do some discovery and here is what I started with:
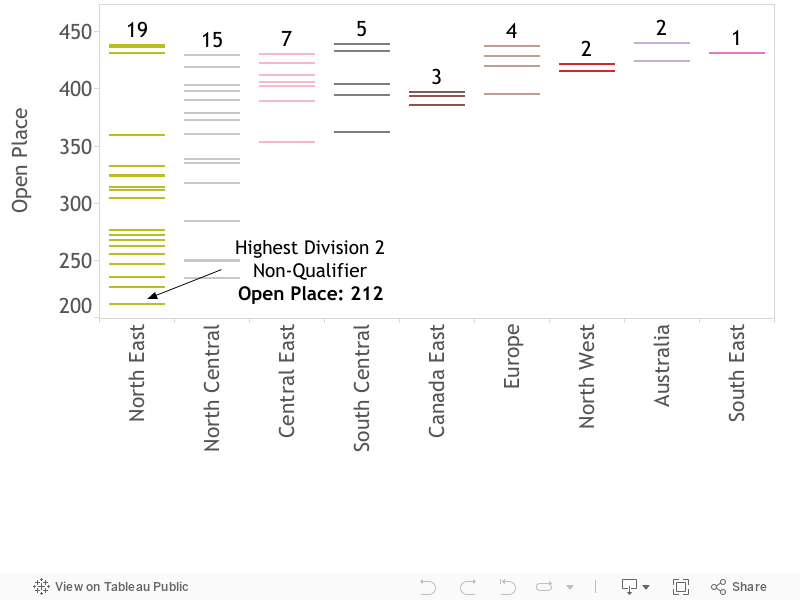
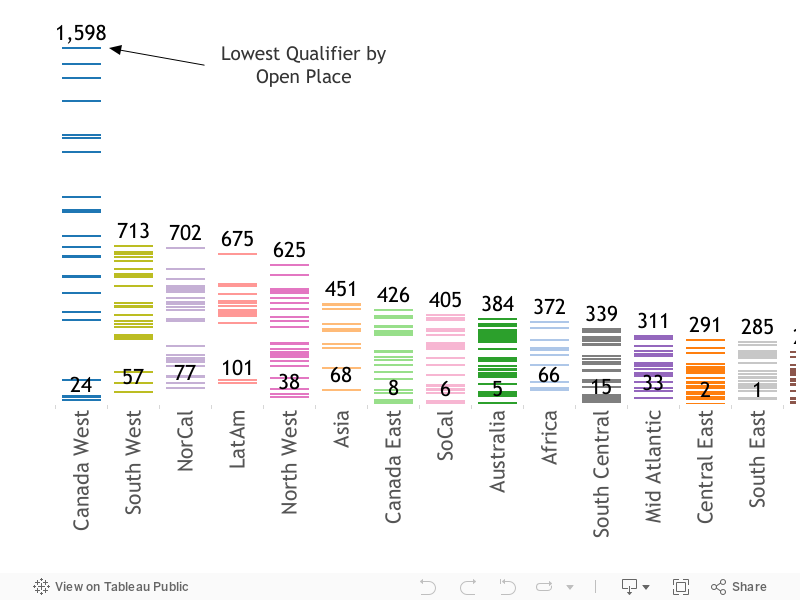
Not very clear, but I did some quick Tableau magic to split the regions into columns and add the minimum and maximum Open Place of Regional qualifiers for each:
Boom! What's up with Canada West? Conversely, North East is stacked. If you want to make it to Regionals next year, you might consider becoming a Calgary Flames fan...
WHO DIDN'T MAKE IT
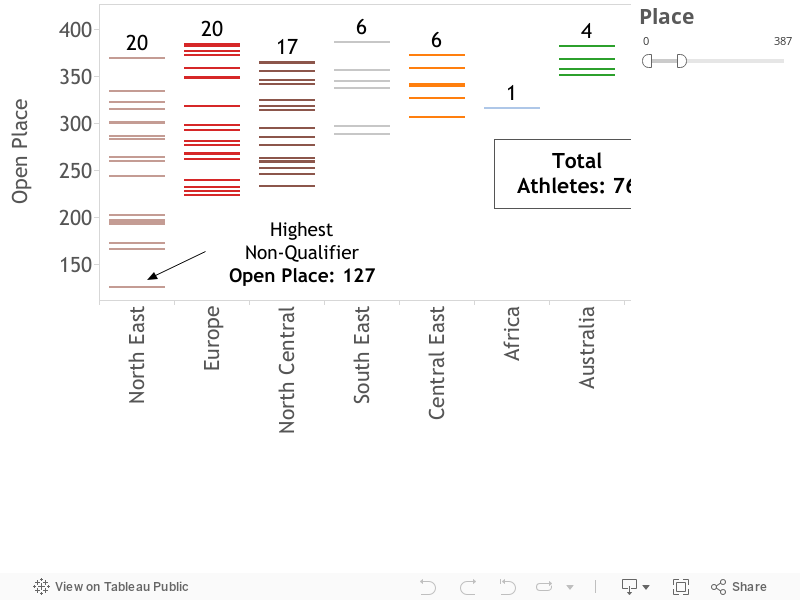
If someone placed 1,598th in the Open and got a Bid to Regionals, someone else who deserved a spot didn't. Let's see who got the shaft:
In all, 76 athletes did well enough in the Open to earn an Invitation, including a North East athlete who placed 129th in the world in the Open... Ouch!
Side Note: Due to the way scores are aggregated in the Open, it is possible for relative scores of athlete's in a region to be in a different order when scored worldwide. This is the case in the North East region where the athlete that finished 21st in the region and did not receive an invitation scored higher when scored against the world (129th) than did the 20th placed athlete in the region (139th). Quirky.
WHAT DOES A REGIONAL COMPETITOR LOOK LIKE
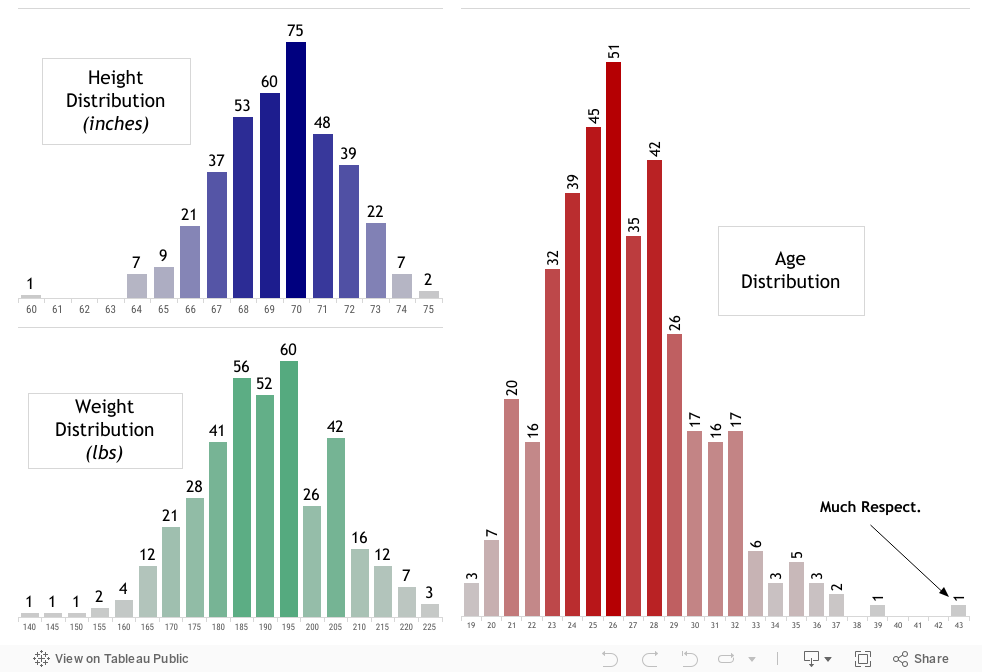
As a larger CrossFitter (6'1", 205 lbs) I've often felt disadvantaged, rowing and wall balls aside, compared to shorter athletes. Here's a quick breakdown of Regional athlete height, weight, and age:
Well damn, looks like I fall well within the range. Back to the drawing board for excuses!
CLOSING THOUGHTS
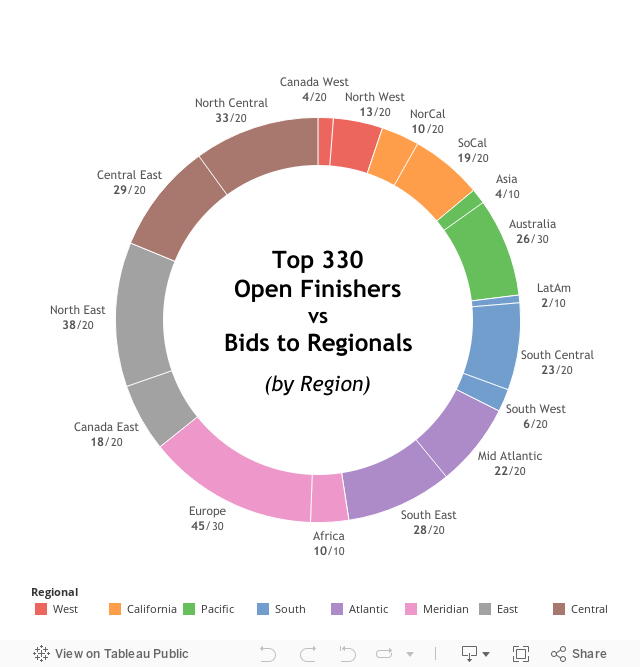
There does seem to be some discrepancy between divisions. This year it might have made sense to take fewer athletes from the Canada West region, and more from the North East. Of course, this will likely fluctuate from year to year, and I have no doubt that CrossFit will continue to evolve it's Games process. Maybe in the future they will add a set number of "at-large" bids for competitors in a stacked division?.. To bring this to a close, here is a chart that I made which emulates one posted by @crossfitgames on Instagram that looks at the top 330 open finishers by Region:
In Part 2 of this series I'll take a look at the ladies, and at some point I'll have a supplemental post with some other chart's I've been working on. You can find more charts on this and other works at the links below. Check me out on GitHub for the code I used to scrape the data from the Games website. I'd love to hear your ideas and feedback!