New Series!
Thanks to some friends, I found a fun set of data to work on this week. Here in the great state of Texas, we like our drinkin'. Due to certain taxes that must be paid to the state for the privilege of selling alcoholic beverages and the public nature of those filings, we can back into the revenue generated by alcohol sales at any venue in Texas. Newspapers/local blogs like to sift through this and post "top 10" lists. It makes for a nice slideshow post (barf). 'Hey what hot new bar that we should've thought of is killing it???' So I set out to do better...In order to do that, I've considered the entire state together, and put a considerable amount of legwork into adding context. More importantly, I have an interactive interface to view the data. To start, there are over 15,000 businesses that report. For the time being I filtered out anything below $1.0mm in annual revenue which culls the list down to about 10% of the original. The tax filings data only includes the name of the legal entity, which can be anything. Sometimes they are obvious, sometimes not. So I set out to add actual business names and a "type" category. Type is a broad category, which I hope to subdivide later for even more context.
At this point I've added detail for the top 200 businesses and tackled some franchises all at once. I hope to chip away at the list as I update the data. There also seems to be a lag in reporting, so I've conservatively chosen to start a couple months back.
You can filter by type and by county -> Dallas / Ft. Worth Metro = Dallas, Tarrant, Collin, Denton Counties, Austin = Travis County, Houston = Harris County, San Antonio = Bexar County (pronounced bear to be safe, if not necessarily accurate)
2016/03 Trailing Twelve Months - Texas Alcohol Revenue
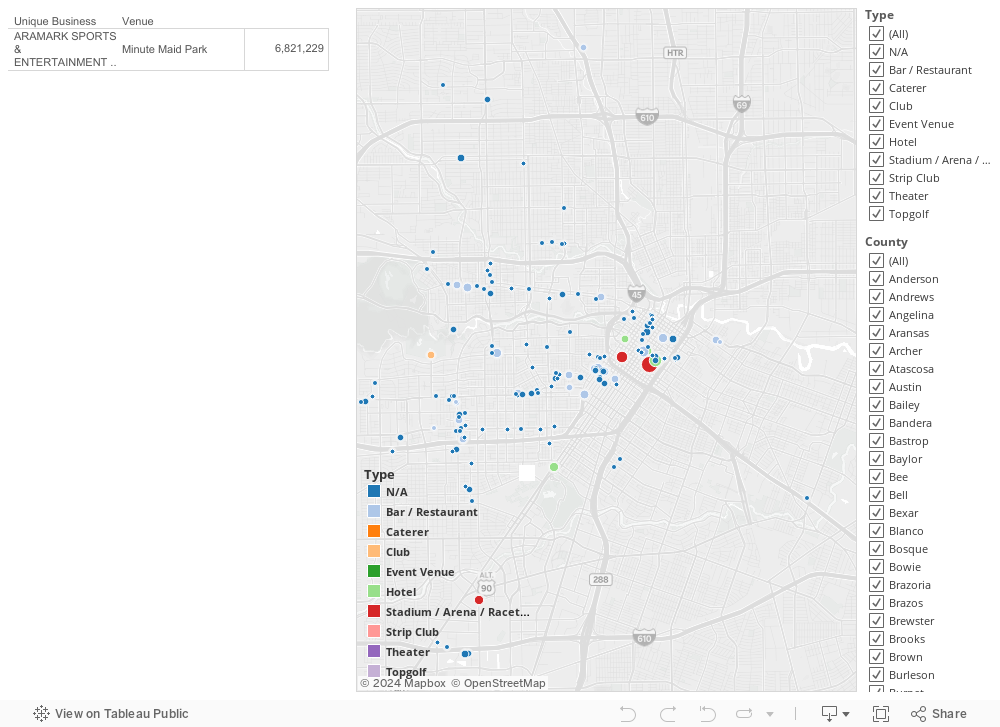
In order to do the map plotting in Tableau I had to get latitude and longitude of each business. In order to do this I used a simple python/pandas script and google maps api. I'll try to get that up on GitHub soon. It worked pretty well, but if you notice any glaring location errors please let me know (my first plot put some businesses in Kansas). Also as far as errors go, I can't for the life of me figure out why Topgolf Allen isn't in these reports. I looked at every entry from Allen and nearby cities, it's not there. If you have an idea why that could be, please let me know (wild speculation encouraged).
If your state/country has similar data, I'd love to know. It would be fun to compare across states. If you have any other ideas/suggestions to improve this, please comment!
-ReEngiNerd
Let's Connect!
Tableau Public Repository
GitHub
@reenginerd on Twitter & Instagram
I'm drunk from your quality analysis
ReplyDeleteI read your posts from all the way in Europe! Keep up the great work.
ReplyDelete