THE SETUP
In Part 1 of this series on The Road to the CrossFit Games I covered the Individual Men who qualified for Regionals. If you missed it, there is a little more explanation about the graphs. In this post, we'll take a look at the same charts for the Individual Women.
WHO GETS IN
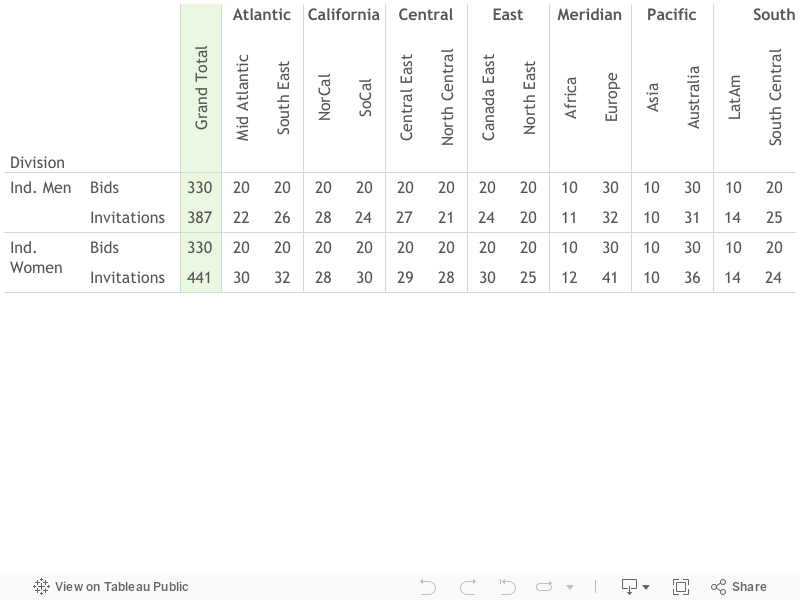
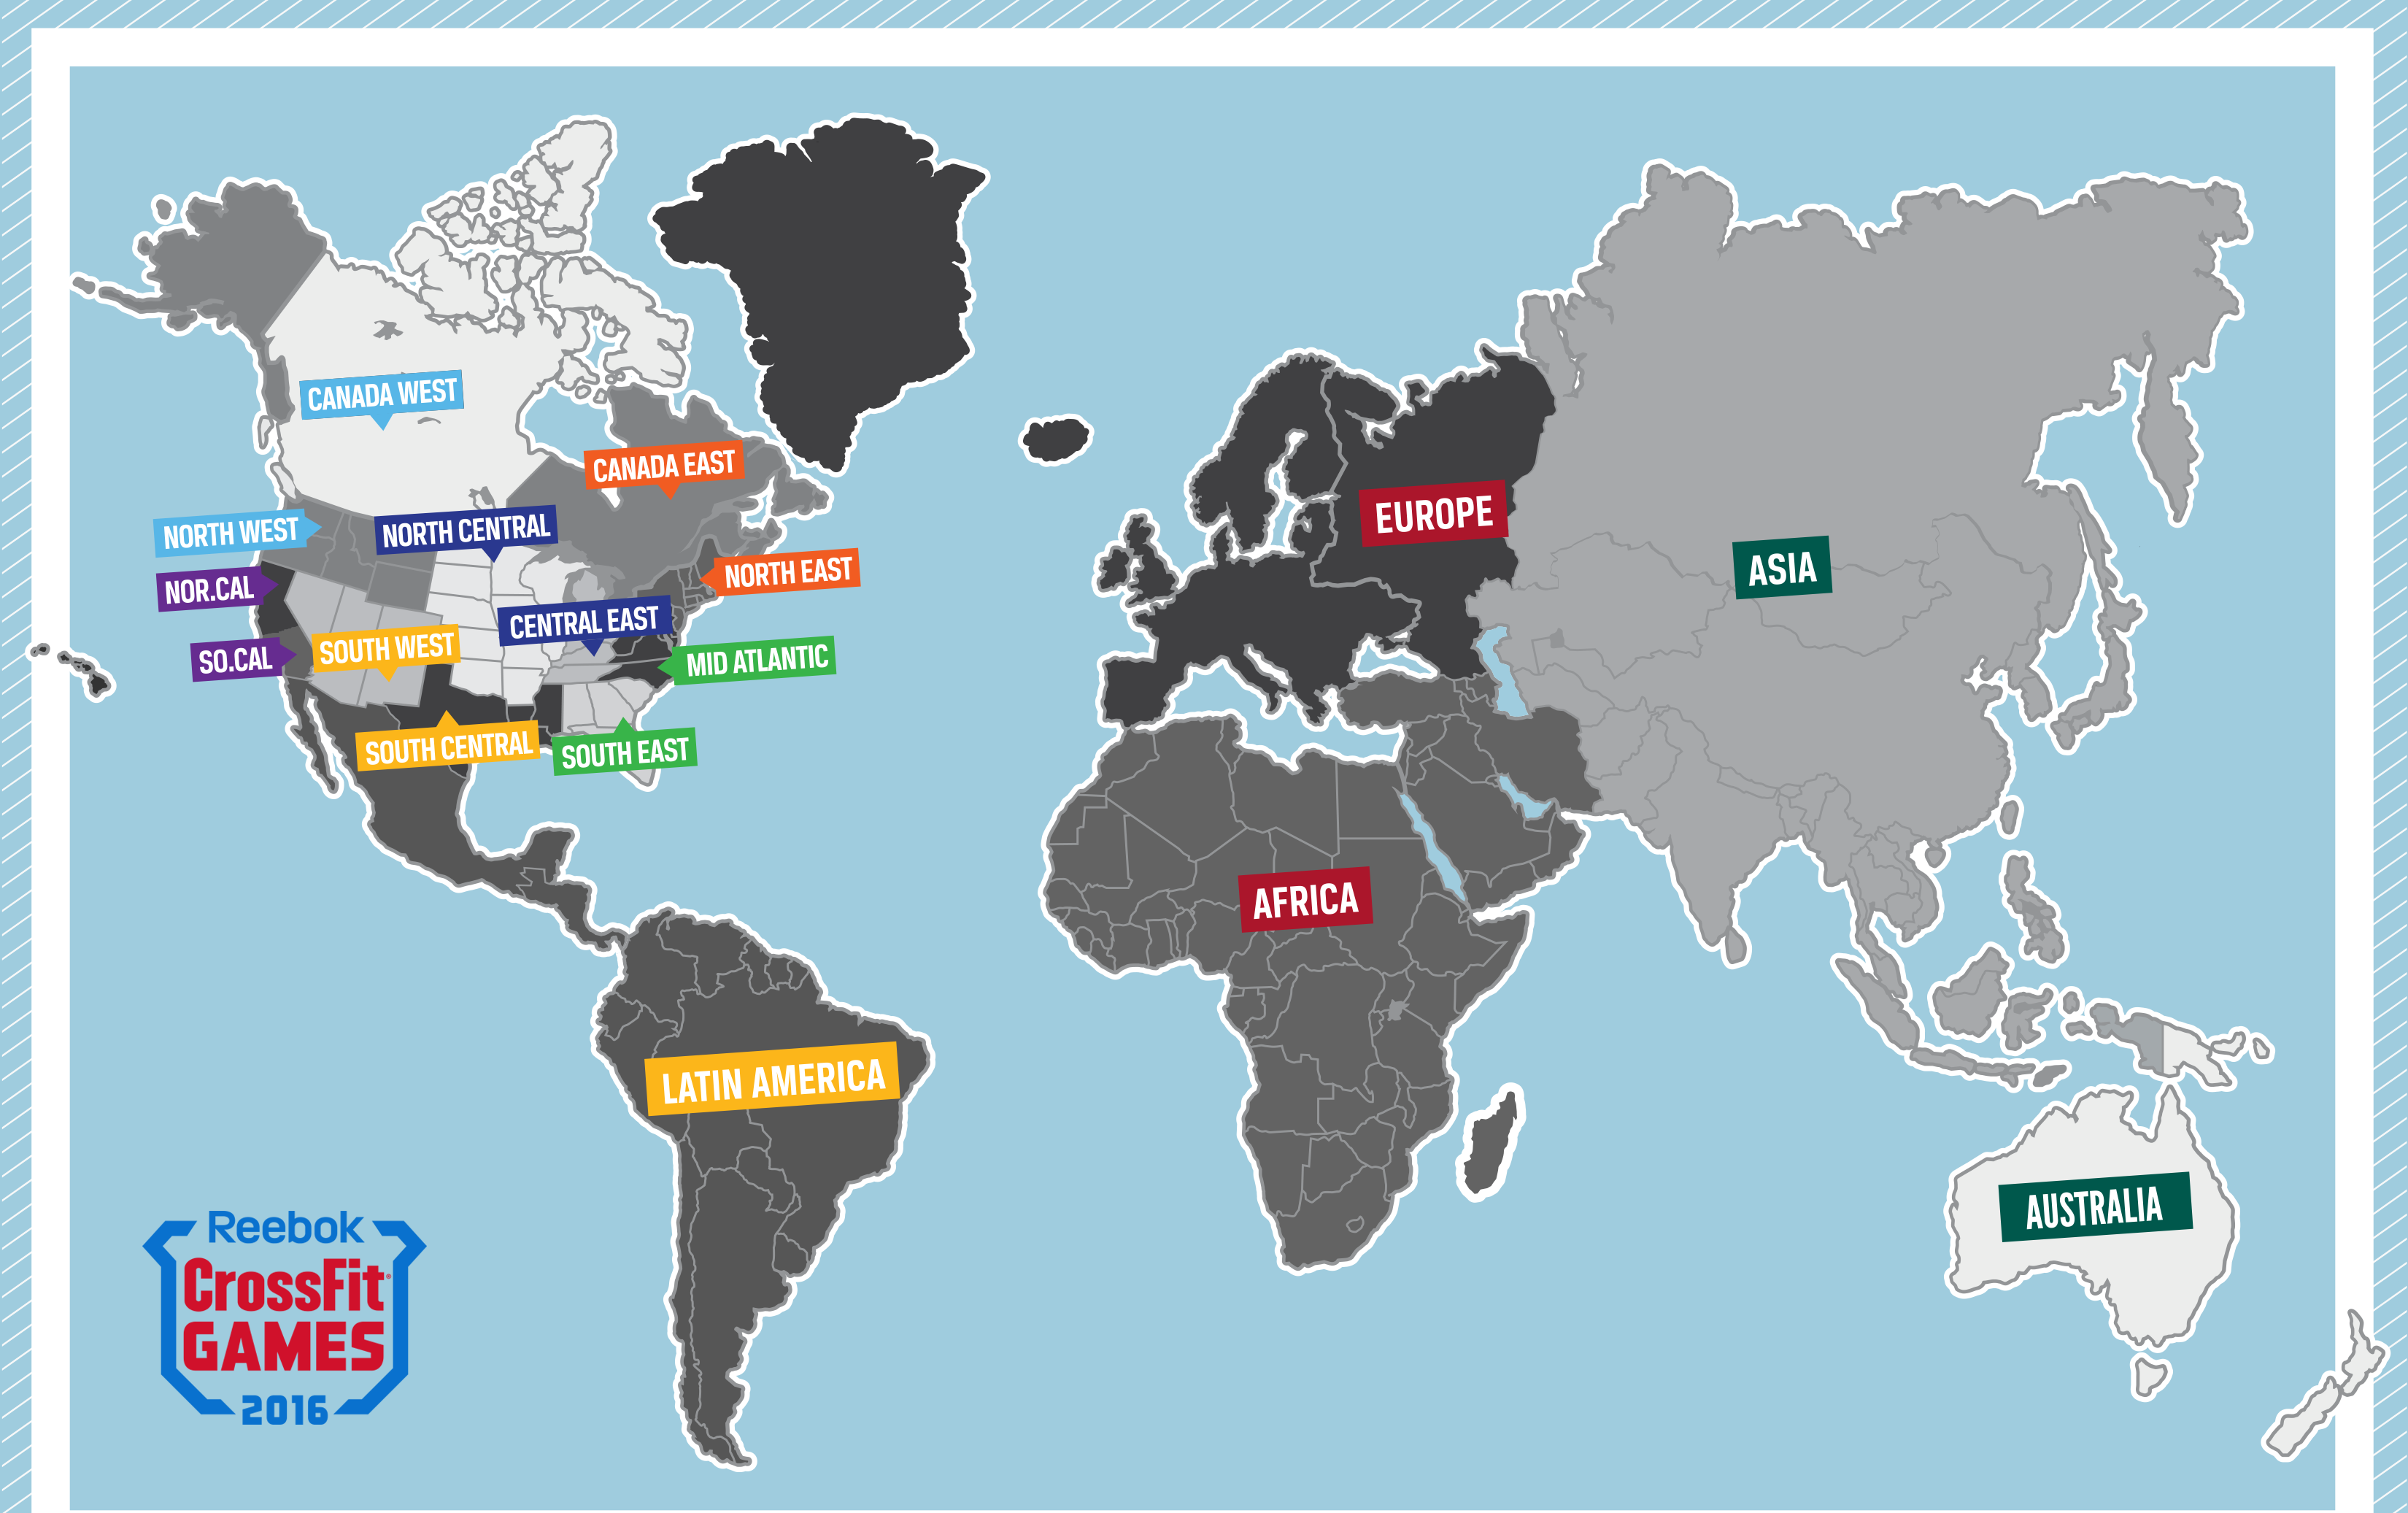
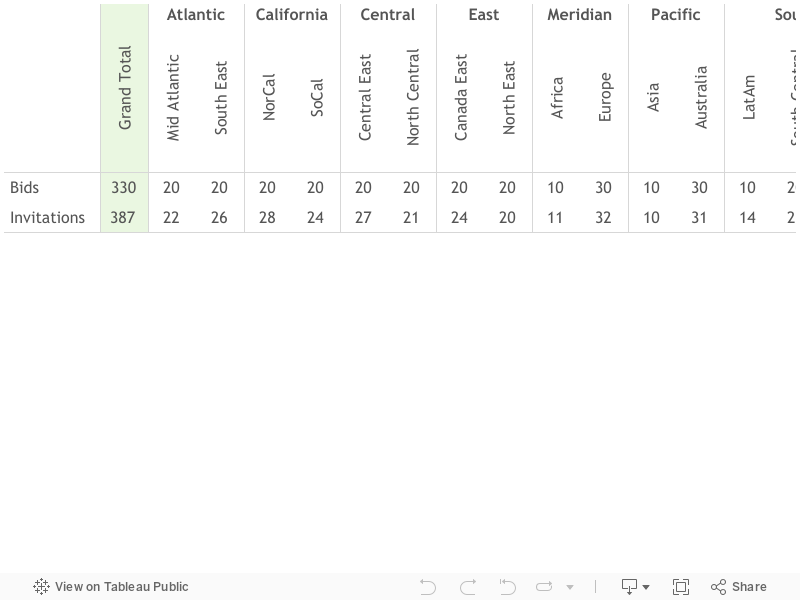
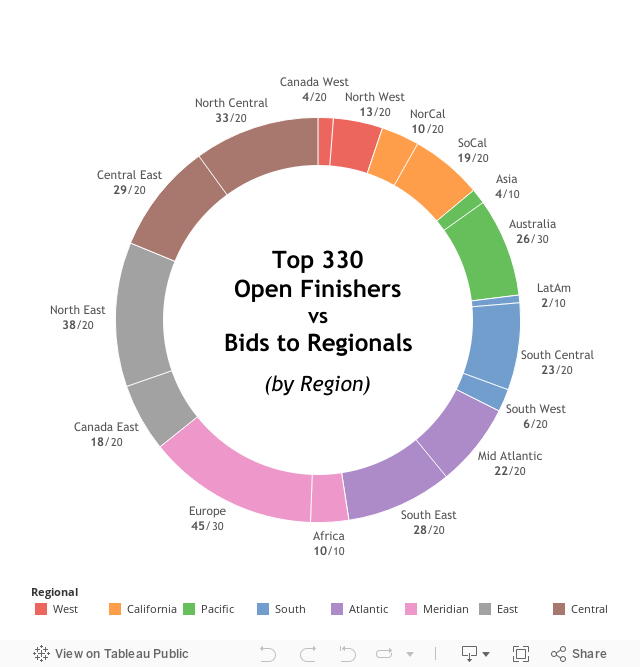
As before, 17 Regions feed the 8 Regional events, most of which receive 20 'Bids'. Australia / Europe receive 30, and Asia / Africa / Latin America (LatAm) receive just 10. Here is the breakdown:
441 Invitations went out to athletes in the Individual Women division to fill the 330 available Regional spots. It took 54 more Invitations to fill the spots than in the Men's Division. 109 women opted to compete on a Regional Team, compared to 56 men. This accounts for most of the difference between total divisional invitations. I guess women are better team players...
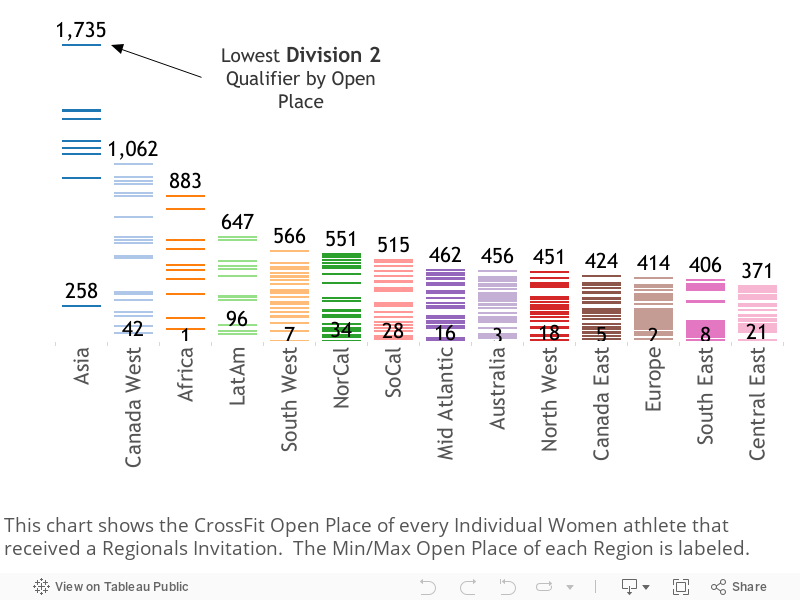
Here is the same Region breakdown by Crossfit Open finish as in part 1:
As with the Men, a couple regions stand out. Asia's last qualifier came in 1,735th place in the open. Canada West moved up to 2nd to last in this division, with their lowest qualifier at 1,062nd. North East region does quite well, just as their men did.
WHO DIDN'T MAKE IT
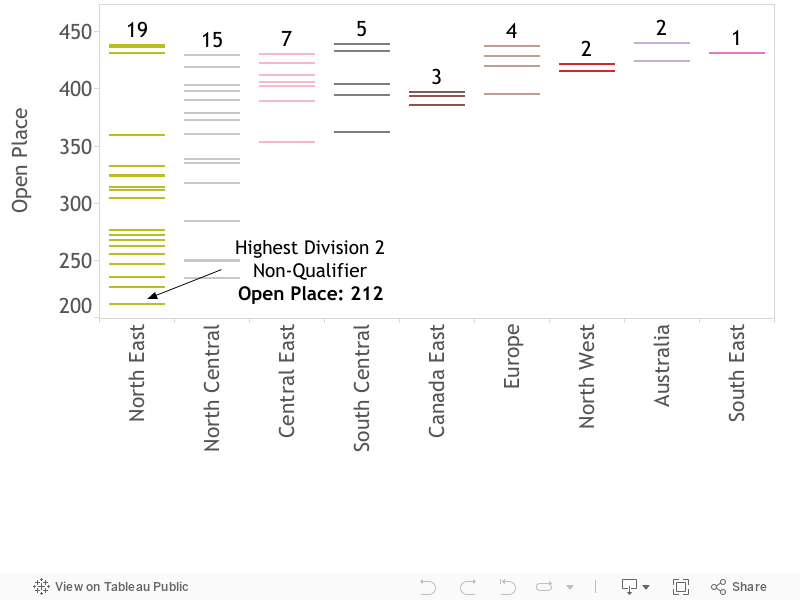
Again if 1,735th made it, someone who did well enough to earn a spot didn't get in. Let's see who got the shaft:
In all, 58 athletes did well enough in the Open to earn an Invitation. This is fewer than on the men's side even though there were 54 more Invitations available.
WHAT DOES A REGIONAL COMPETITOR LOOK LIKE
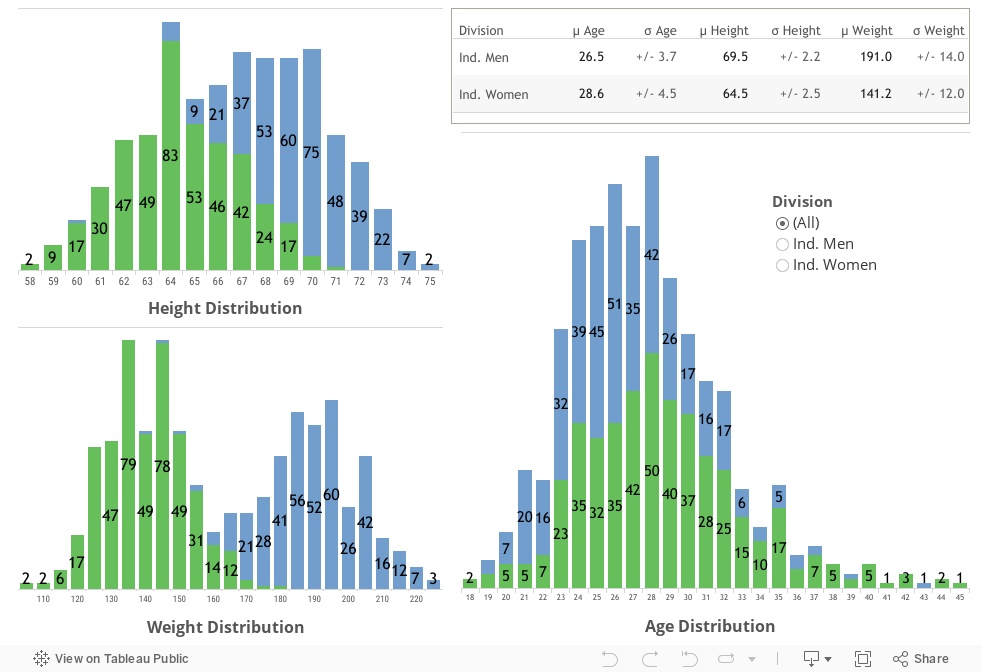
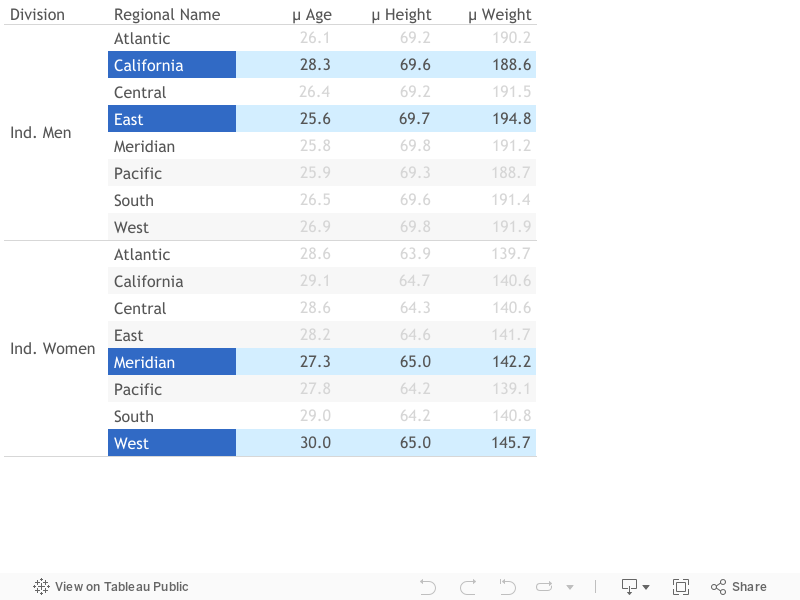
Here's a quick breakdown of Regional athlete height (inches), weight (pounds), and age:
Obviously, the men are taller and heavier on average, but it's interesting that they are about 2 years younger on average with a lower variance.
Looking around for regional differences, these age averages seemed notable:
CLOSING THOUGHTS
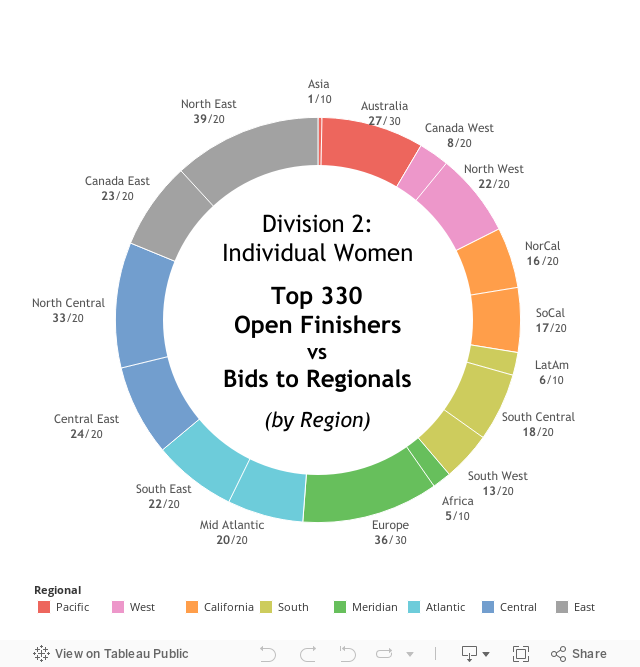
Similar results as in part 1. The women did have far fewer athletes do well enough in the Open to qualify for Regionals and not get an Invitation. And I'll close with the same graph that looks at the top 330 open finishers by Region:
In Part 3 of this series I’ll look more at what the stats mean in relation to the workouts and maxes, and attempt my first CrossFit advanced stat. At some point I also want to see if any of the data I’ve collected could’ve helped us predict who would perform well at the Regional competitions. Stay tuned!
Check me out on GitHub for the code I used to scrape the data from the Games website. I'd love to hear your ideas and feedback!
-sof
Let's Connect!
Tableau Public Repository
GitHub
@reenginerd on Twitter & Instagram
THE SETUP
The road to the CrossFit Games continued last weekend with the first 3 Regional events, and as a former CrossFit Open participant (43,692nd place in 2015 Open!) I was curious about what it takes to make it to the Regional level. The CrossFit Games website offers a fair amount of data to work with, from the CrossFit Worldwide Open Places and Scores, to athlete data such as Age, Height, and Weight. Many of the athletes also self report some benchmark scores and weights that I hope to do something with in the future. That data is not as complete, so I'll stick with Open Place and the personal data for this first go round. For an overview of the Games process, check this out.
WHO GETS IN
17 Regions feed the 8 Regional events, most of which receive 20 'Bids'. Australia / Europe receive 30, and Asia / Africa / Latin America (LatAm) receive just 10.
In all, there are 330 Regional 'Bids' up for grabs. Many athletes who qualified chose to compete on a team or declined altogether, in which case the Region receives extra 'Invitations' until it fills its allotted Bids. Here is the breakdown:
387 Invitations went out to athletes in the Individual Men division to fill the 330 available Regional spots.
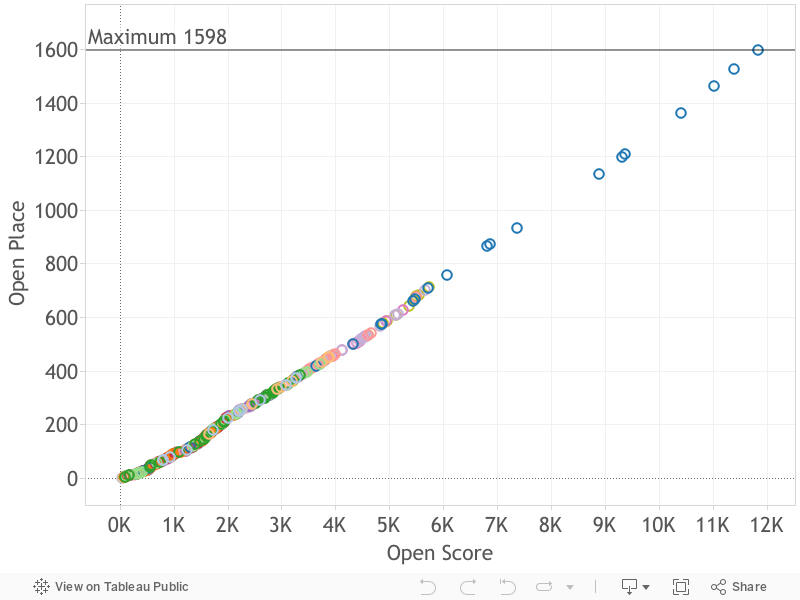
So I fired up Tableau to do some discovery and here is what I started with:
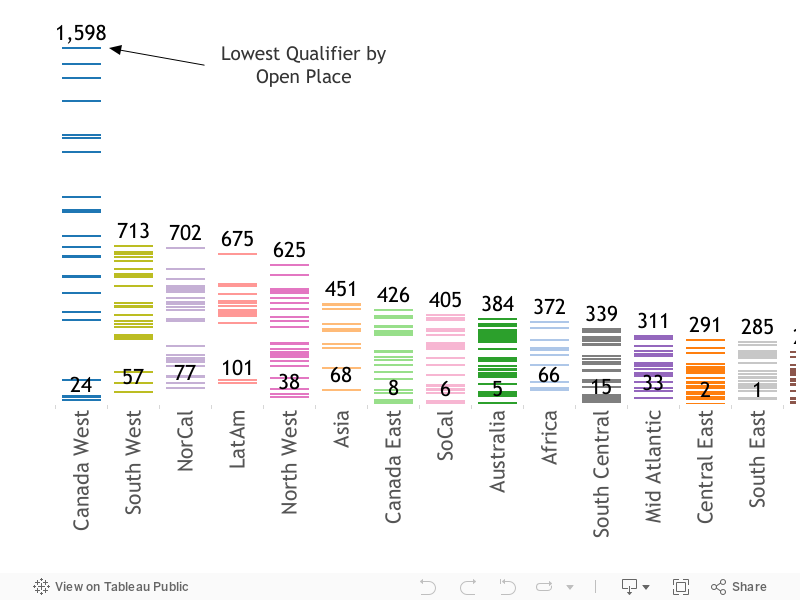
Not very clear, but I did some quick Tableau magic to split the regions into columns and add the minimum and maximum Open Place of Regional qualifiers for each:
Boom! What's up with Canada West? Conversely, North East is stacked. If you want to make it to Regionals next year, you might consider becoming a Calgary Flames fan...
WHO DIDN'T MAKE IT
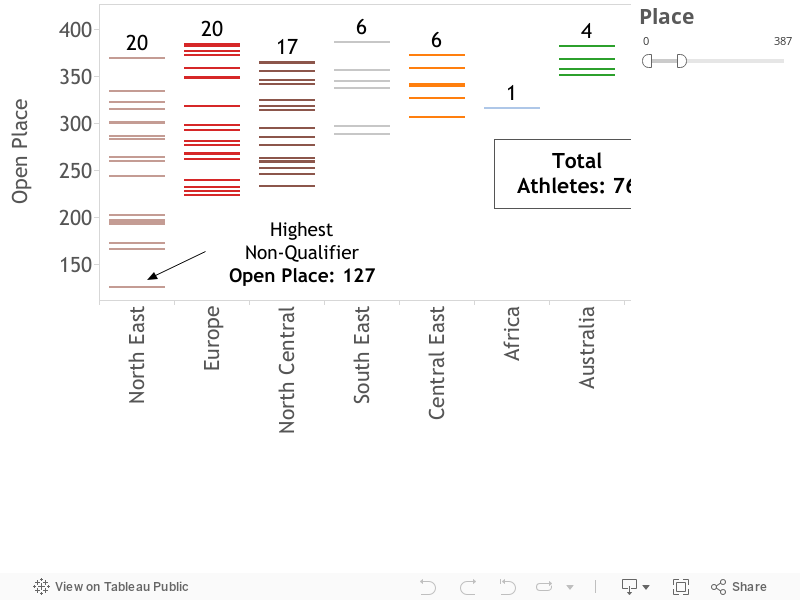
If someone placed 1,598th in the Open and got a Bid to Regionals, someone else who deserved a spot didn't. Let's see who got the shaft:
In all, 76 athletes did well enough in the Open to earn an Invitation, including a North East athlete who placed 129th in the world in the Open... Ouch!
Side Note: Due to the way scores are aggregated in the Open, it is possible for relative scores of athlete's in a region to be in a different order when scored worldwide. This is the case in the North East region where the athlete that finished 21st in the region and did not receive an invitation scored higher when scored against the world (129th) than did the 20th placed athlete in the region (139th). Quirky.
WHAT DOES A REGIONAL COMPETITOR LOOK LIKE
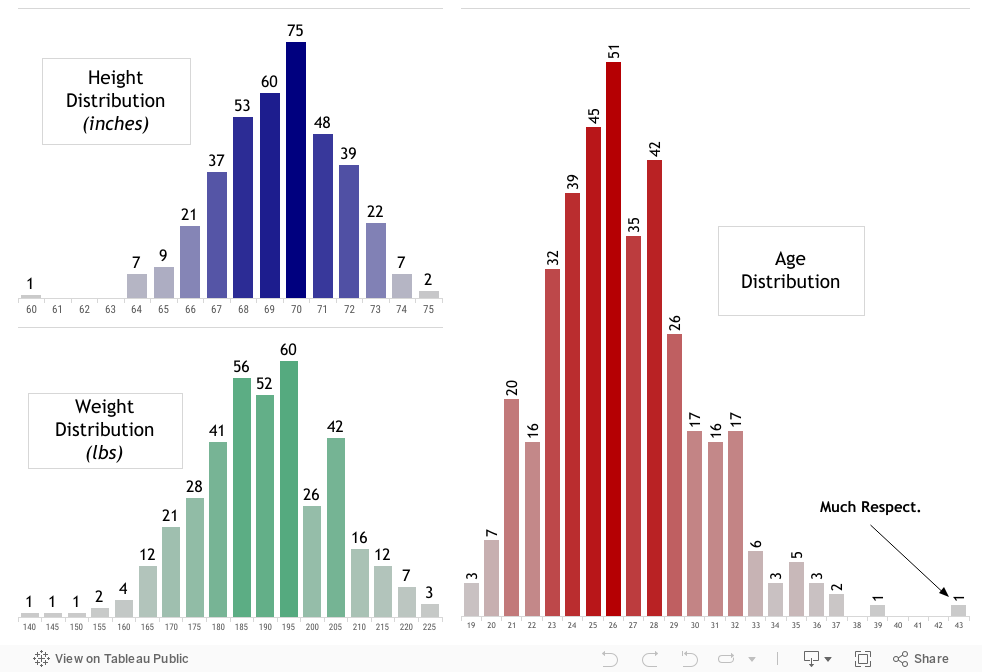
As a larger CrossFitter (6'1", 205 lbs) I've often felt disadvantaged, rowing and wall balls aside, compared to shorter athletes. Here's a quick breakdown of Regional athlete height, weight, and age:
Well damn, looks like I fall well within the range. Back to the drawing board for excuses!
CLOSING THOUGHTS
There does seem to be some discrepancy between divisions. This year it might have made sense to take fewer athletes from the Canada West region, and more from the North East. Of course, this will likely fluctuate from year to year, and I have no doubt that CrossFit will continue to evolve it's Games process. Maybe in the future they will add a set number of "at-large" bids for competitors in a stacked division?.. To bring this to a close, here is a chart that I made which emulates one posted by @crossfitgames on Instagram that looks at the top 330 open finishers by Region:
In Part 2 of this series I'll take a look at the ladies, and at some point I'll have a supplemental post with some other chart's I've been working on. You can find more charts on this and other works at the links below. Check me out on GitHub for the code I used to scrape the data from the Games website. I'd love to hear your ideas and feedback!
-sof
Let's Connect!
Tableau Public Repository
GitHub
@reenginerd on Twitter & Instagram