THE SETUP
In Part 1 of this series on The Road to the CrossFit Games I covered the Individual Men who qualified for Regionals. If you missed it, there is a little more explanation about the graphs. In this post, we'll take a look at the same charts for the Individual Women.WHO GETS IN
As before, 17 Regions feed the 8 Regional events, most of which receive 20 'Bids'. Australia / Europe receive 30, and Asia / Africa / Latin America (LatAm) receive just 10. Here is the breakdown: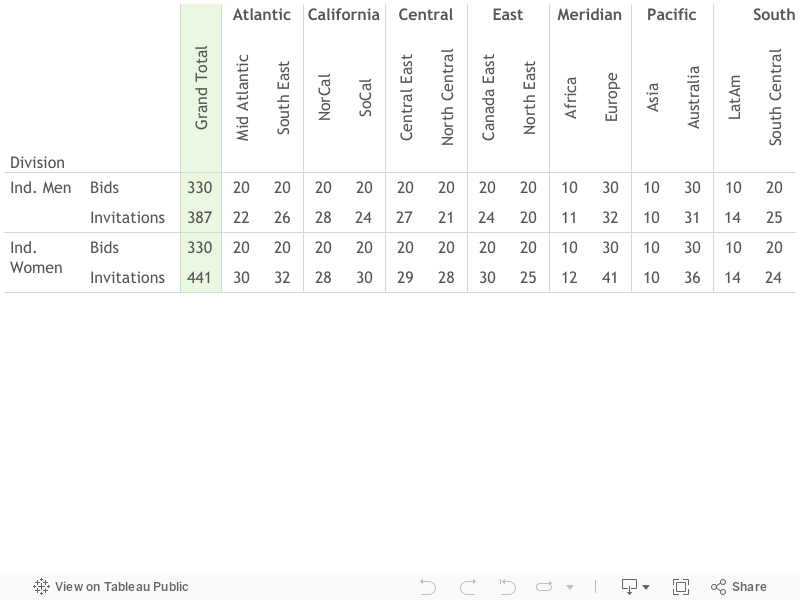
441 Invitations went out to athletes in the Individual Women division to fill the 330 available Regional spots. It took 54 more Invitations to fill the spots than in the Men's Division. 109 women opted to compete on a Regional Team, compared to 56 men. This accounts for most of the difference between total divisional invitations. I guess women are better team players... Here is the same Region breakdown by Crossfit Open finish as in part 1:
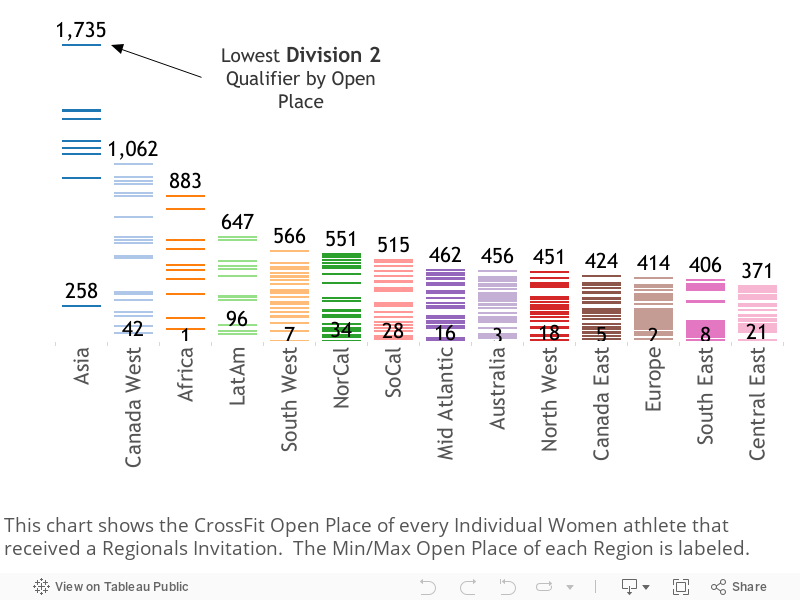
As with the Men, a couple regions stand out. Asia's last qualifier came in 1,735th place in the open. Canada West moved up to 2nd to last in this division, with their lowest qualifier at 1,062nd. North East region does quite well, just as their men did.
WHO DIDN'T MAKE IT
Again if 1,735th made it, someone who did well enough to earn a spot didn't get in. Let's see who got the shaft: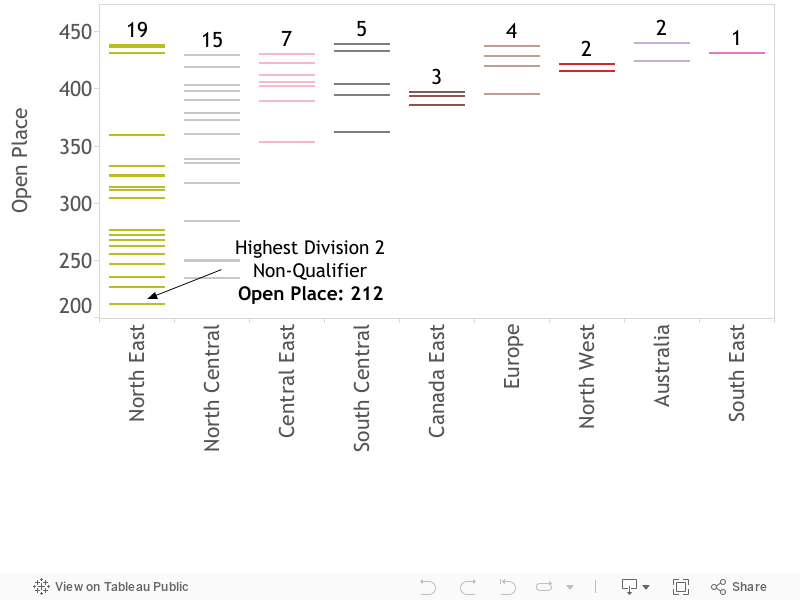
In all, 58 athletes did well enough in the Open to earn an Invitation. This is fewer than on the men's side even though there were 54 more Invitations available.
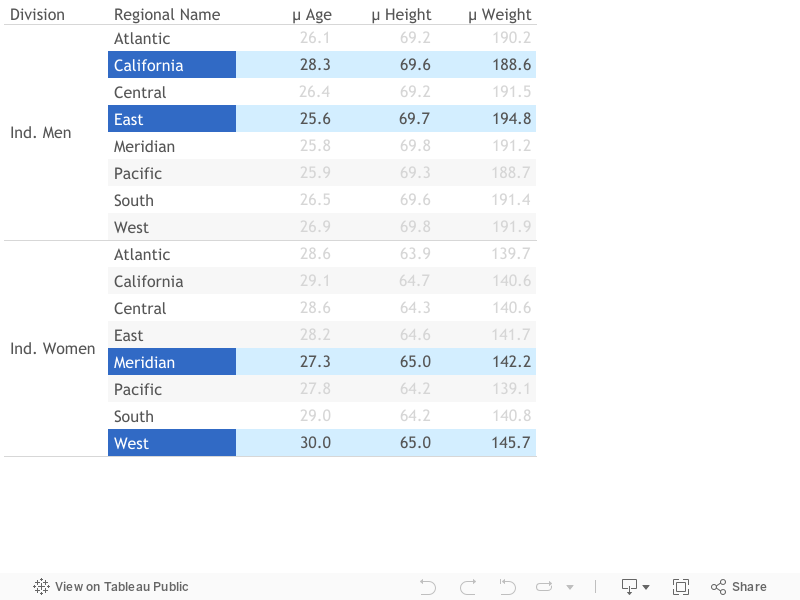
WHAT DOES A REGIONAL COMPETITOR LOOK LIKE
Here's a quick breakdown of Regional athlete height (inches), weight (pounds), and age: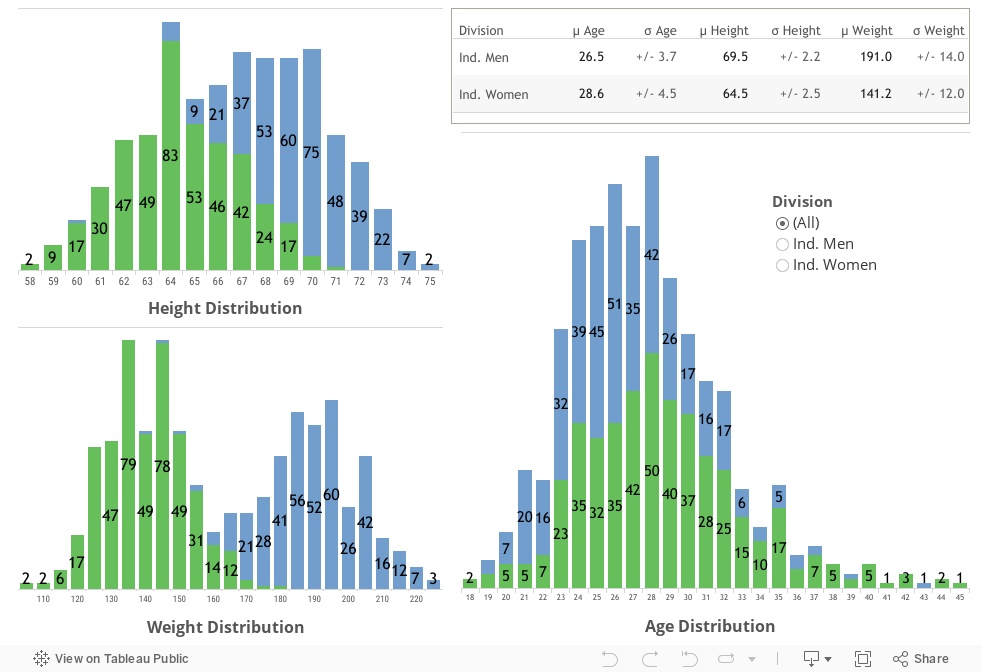
Obviously, the men are taller and heavier on average, but it's interesting that they are about 2 years younger on average with a lower variance.
Looking around for regional differences, these age averages seemed notable:
CLOSING THOUGHTS
Similar results as in part 1. The women did have far fewer athletes do well enough in the Open to qualify for Regionals and not get an Invitation. And I'll close with the same graph that looks at the top 330 open finishers by Region: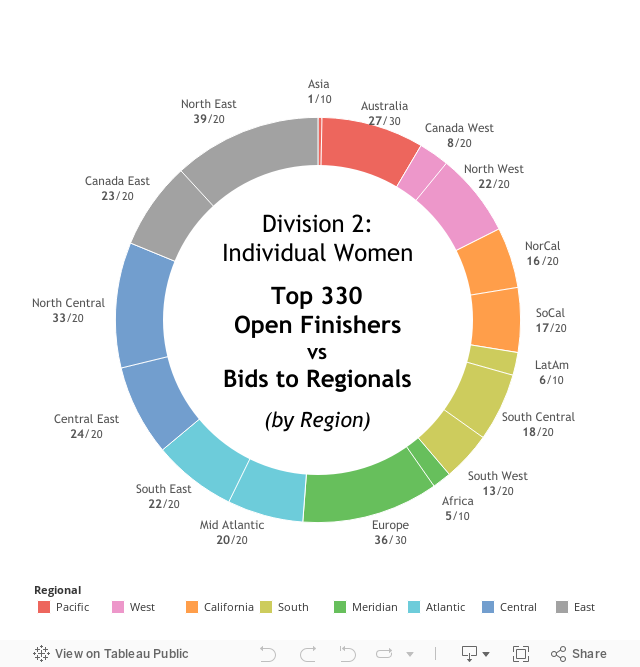
In Part 3 of this series I’ll look more at what the stats mean in relation to the workouts and maxes, and attempt my first CrossFit advanced stat. At some point I also want to see if any of the data I’ve collected could’ve helped us predict who would perform well at the Regional competitions. Stay tuned! Check me out on GitHub for the code I used to scrape the data from the Games website. I'd love to hear your ideas and feedback!
-sof
Let's Connect!
Tableau Public Repository
GitHub
@reenginerd on Twitter & Instagram
No comments:
Post a Comment