In MAWFF#1, we looked at the scoring trends by position over the last 10 years in standard scoring fantasy leagues. Some might say that a point is a point, but when it comes to touchdowns, it's 6 (4 for standard league QBs) or 0. This leads to wild score swings for players who rely heavily on reaching the end zone. So I wanted to take a look at the players who depend most on this aspect of scoring, in an effort to consider who I should be wary of repeating their 2015 performance.
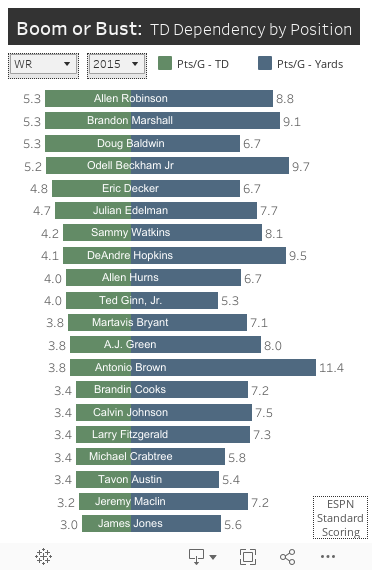
Here's a look at the fantasy players who depend most on the TD:
So you need to decide for your team: Do you want a player that produces on the field each week and is reliable for 5-10 pts by yards gained, or do you want a guy that is going to go big some weeks and score 3 pts when they dont reach the end zone?
Look at Demaryius in 2013, Dez in 2014, and... 'Doug' in 2015. All 3 relied heavily on their TD production to achieve their great seasons. I like to make sure the offense will be the same before betting on this kind of performance again. Is the QB the same (cough... Romo)? Has the offense lost a guy whose nickname is Beastmode? How will that affect that guy's ability to get into the end zone.
Look at Tyrod and Cam last year. About the same production from yards gained, but Cam scored a touchdown per game more. Kirk Cousins found the end zone plenty last season, but are you gonna bet on Kirk Cousins?
TE, look at Julius Thomas 2014 vs 2015. 3.8 points from yards each year, but a drop from 5.5 points from touchdowns to just 2.5 a game. Same on field production... [At this point I realize I ended up with him at the end of my auction draft... and... replaced. Phew. Pretty sure I just reverse jinxed him, so you should start him week 1].
Looking back through RB, it's fun enraging to see the vultures make the list. Look at 2010, Javarris James 1.6 points from yards per game, but he scored 6 touchdowns in 10 games played. Lol, who? #specialist
What do you guys think? Does anyone else like to break it down this way?
Let's Connect!
Tableau Public Repository
GitHub
StackOverflow
@reenginerd on Twitter & Instagram
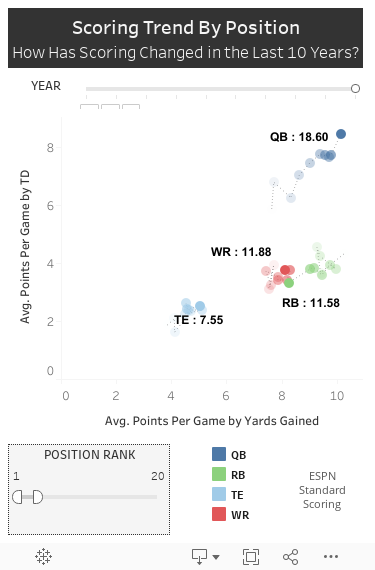
In this first MAWFF post, I take a quick look at how fantasy scoring has evolved over the last 10 years. In the graph below, I show the following:
- Top 20 Players by Average Points Per Game by Position by Year
- Must have played at least 10 games
- Graph compares Points Per Game by Yards Gained vs Points Per Game by TD
A couple notable trends stick out:
- QB: Notable rise in points per game in both yard and TD points.
- RB: Reduction in both yard and TD points. This could be due to a reduction in overall RB productivity as the passing game has increased and/or a spreading of the RB load with more RBs by committee in use.
- TE: Small but meaningful increase in TE offensive productivity, especially at the top end with the likes of Rob Gronkowski and Jimmy Graham.
- WR: Not a huge change over 10 years. With the increase in QB productivity, the receiving yards and TDs look to be going to non-top 20 WRs. TEs and pass-catching RBs are the likely beneficiaries.
What do you guys think? How has this affected your draft over the last couple years?
Let's Connect!
Tableau Public Repository
GitHub
StackOverflow
@reenginerd on Twitter & Instagram