- Top 20 Players by Average Points Per Game by Position by Year
- Must have played at least 10 games
- Graph compares Points Per Game by Yards Gained vs Points Per Game by TD
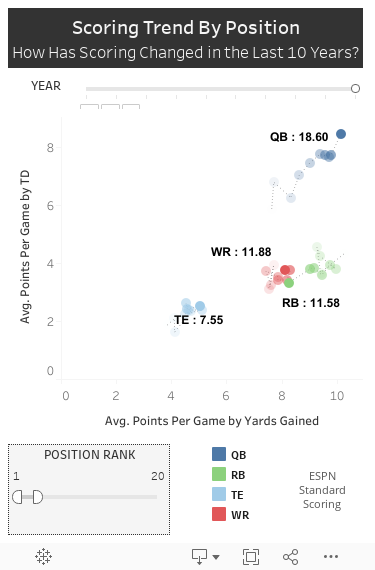
A couple notable trends stick out:
- QB: Notable rise in points per game in both yard and TD points.
- RB: Reduction in both yard and TD points. This could be due to a reduction in overall RB productivity as the passing game has increased and/or a spreading of the RB load with more RBs by committee in use.
- TE: Small but meaningful increase in TE offensive productivity, especially at the top end with the likes of Rob Gronkowski and Jimmy Graham.
- WR: Not a huge change over 10 years. With the increase in QB productivity, the receiving yards and TDs look to be going to non-top 20 WRs. TEs and pass-catching RBs are the likely beneficiaries.
Let's Connect!
Tableau Public Repository
GitHub
StackOverflow
@reenginerd on Twitter & Instagram
No comments:
Post a Comment