With only 5 spots available from each Regional, it’s very likely that some great athletes won’t be competing at the Games due to the Regional that they competed at. There are clearly stronger Regionals that might deserve more than 5 bids, and conversely there are weaker Regionals. In part 4 of this series I’ve been doing on the CrossFit Games, I set out to score all 8 Regionals against each other to see how well the current system did at selecting the top 40 athletes. CFHQ has shown that they are always evolving this process, which has improved, and I believe will continue to improve. To finish this piece I’ll take a look at some ideas to help achieve that end.
GETTING STARTED
Before we look at the scores, I tried to eliminate (or at least be conscious of) any bias that might skew the results. I first thought there might be an advantage to the athletes that competed in the 3rd week due to them having more time to practice and strategize events. Here are the average times / scores for each event by week:
There does appear to be some advantage, but with a small sample size, it could be due to just having a stacked Regional. I wanted to improve this, so I eliminated the outliers by normalizing the Open scores of the athletes and considering only those within 1 standard deviation of the mean Open score. Let’s take another look.

That is a much different picture. There is almost no improvement for the men and none for the women.
There are some other forms of bias that I cannot do anything about, such as the fact that most of these competitors didn’t actually compete against one another. That is that an athlete might work just hard enough to win his Regional when he could’ve done better.
SCORING
So with that out of the way, let’s talk about scoring. For this exercise I chose to score the Regionals like the Open. Scores for each event are rank ordered with your place in an event awarded as your score. An athlete's overall score is equal to the sum of his/her places in each event. The athlete with the lowest overall score is in 1st Overall Regional Place.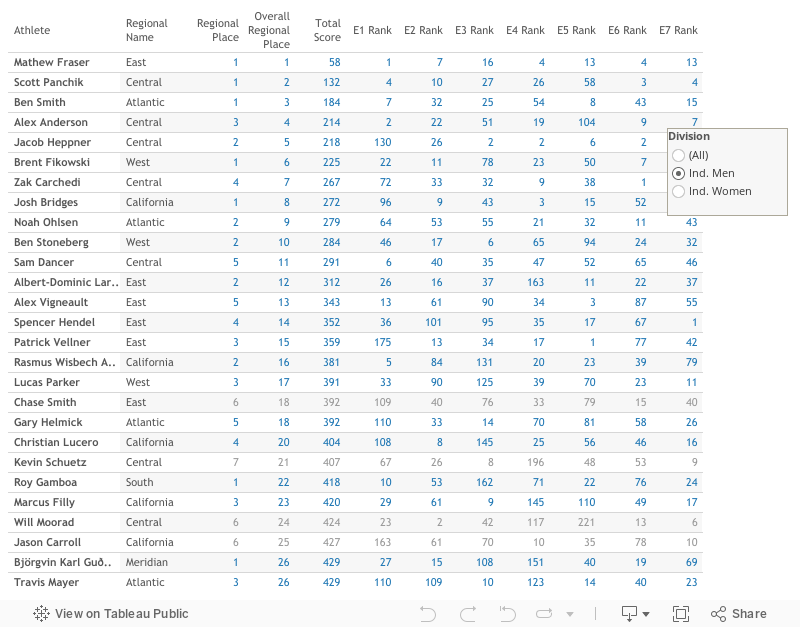
There are obviously other ways to attempt an overall scoring of the Regionals. The order may change, but the point is the same. Not all Regionals are created equal – it’s easier to make it to the games in some Regionals than others. In a system set up the way these Regionals are, you can’t hope to get the top 40 athletes every time. This is a problem that many sports face, and people usually write off strong divisions to seasonality – that in the long run things even out. Where The CrossFit Games differs is that it is an open tournament with geographically based bids. Yes, some athletes do move around, particularly in North America, but it's not the same as a free agent / draft system that seeks to prop up weaker teams. The CrossFit Games is still young, relatively speaking, and they make changes every year. As recently as 2014, each Region (17) held its own Regional. In that system, the top 3 athletes qualified for the Games in many Regions, with fewer in some. These would be the Games qualifiers in 2016 under that system:
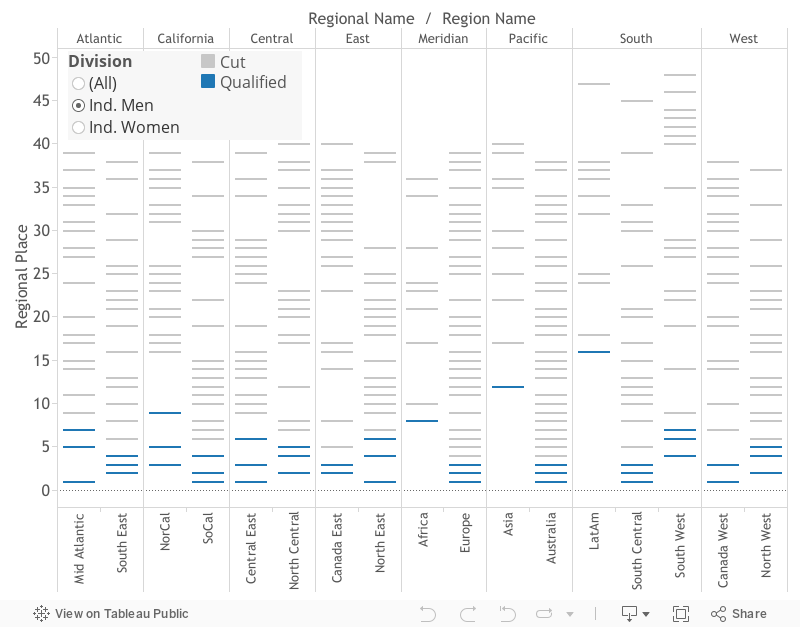
Combining 17 Regions into 8 Regionals is a big improvement, as it lowers the error and allows strong Regions (e.g. Europe Women) to win 5 bids. When the Europe Women previously had only 3 bids (2014), then reigning champ Samantha Briggs finished in 4th place and failed to qualify. Under the current system she would have qualified at the expense of a likely lesser athlete from the Africa Region. Despite the improvement, there are still some seemingly worthy athletes that didn't make the cut. Here is a look at this years qualifiers and their Overall Regional Place:
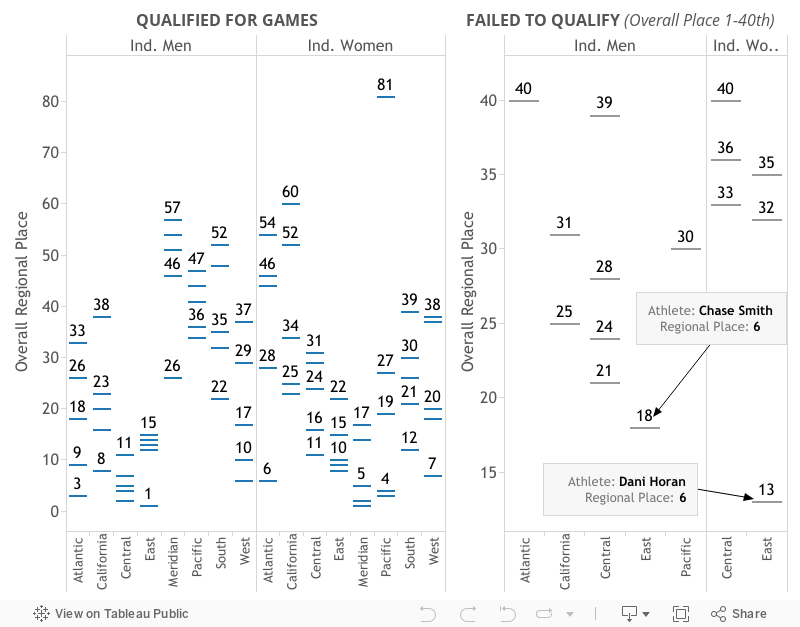
There is definitely improvement, but still 6 women and 9 men who theoretically might be top 40 didn't qualify. When the 13th best Regionals competitor fails to get 1 of 40 spots, there is an argument to be made for changes.
IDEAS FOR THE FUTURE
I’m certain that CFHQ is taking feedback and planning improvements without my help, but here are some ideas I have to improve the process. As with many of the major sports (in America at least), they could consider creating wildcard bids for the best athletes who did not auto-qualify at their Regional. To begin this could mean altering the current system by reducing auto-bids to 4 (32 total auto-bids) and adding 8 wildcard spots to be awarded to the top 8 finishers across all Regionals. Of course to do that you also need a scoring system that can be used to compare the athletes from different regions. You could also allocate wildcard bids to 'Super-Regionals' such as 'The Americas' and 'The World'.To quantify the impact of potential changes, I’ve taken the average overall place of all 2016 games qualifiers under the different selection systems:
1) Old System (Bids for each Region)
2) Current System (5 bids for each Regional)
3) Wildcard System (4 bids for each Regional / 1 Wildcard per Regional)
To judge the effectiveness of a system, I've defined the following term:
Selection Error = Average Overall Place – 20.5
20.5 is the theoretical best (lowest) Average Overall Place. If a system selects the top 40 placing overall athletes, the average place will equal 20.5. The smaller the Selection Error, the better the method.

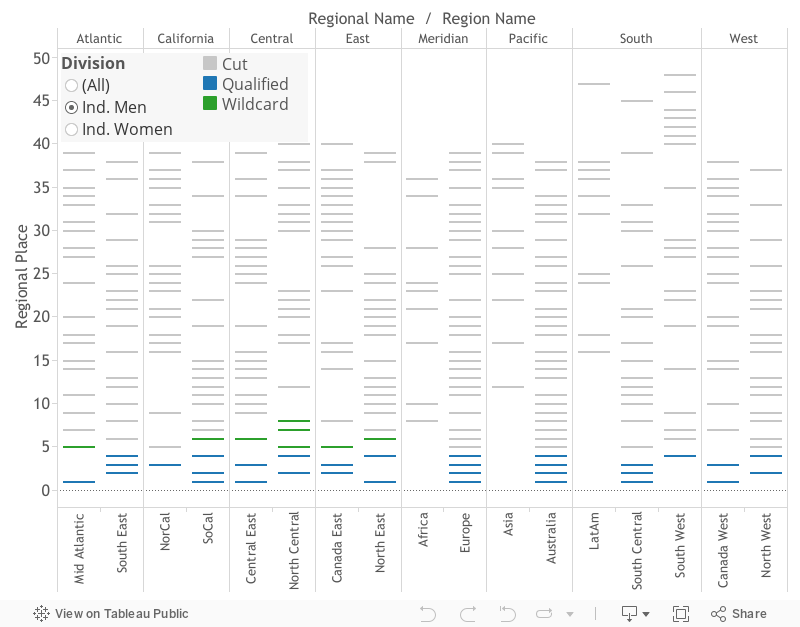
The wildcard system would make another huge jump forward in the selection process. Here are the athletes who would've qualified in 2016. It is clear that strong Regionals are rewarded, while still pulling athletes from around the globe:
CONCLUSIONS
No, the Regionals process wasn’t perfect, but it is getting better. I don’t want this to come across as harsh criticism, because that is not my intent, nor is it deserved. More than one major sport has dealt with a similar issue recently. Until recent years, the NBA was dominated by the Western Conference, leading people to suggest the league takes the top 16 teams overall to the playoffs instead of 8 from each conference. The MLB added another wildcard team to the playoffs a couple years ago and has the wildcard teams play a ridiculous 1 game series to get into the real playoffs. Conversations around these issues usually lead to the same conclusions: 1) do we really care that much about the worst teams to get into the postseason, 2) just win your division… Ultimately that is how I feel here > #WINYOURDIVISION. There are other advantages to a wildcard system though. Mainly with the possibility of an athlete on the bubble getting in, it keeps bubble athletes working as hard as possible thereby improving the competition. Also, it ties a nice little bow around all of the Regionals, which might cause more fans of week 1 Regionals to watch the week 3 Regionals to see who will get the wildcard bids.So keep doing what you’re doing CrossFit, and I look forward to what you have in store for the future.
-ReEngiNerd
Let's Connect!
Tableau Public Repository
GitHub
@reenginerd on Twitter & Instagram